Lab 2 - Installing Prometheus (container image)
Lab Goal
This lab guides you through installing Prometheus using an open source container image on your local machine, configuring, and running it to start gathering metrics.
Prometheus - Container installation notes
This lab guides you through installing Prometheus using Podman, an open source container
tooling set that works on Mac OSX, Linux, and Windows systems. This workshop assumes you have
installed, initialized, and
running Podman on
your machine:
The rest of this lab is pictured using Mac OSX, but it is assumed you have enough knowledge of your Linux or Windows systems to be able to achieve the same results. Also note that you can run this workshop using Docker, but let's you sort out the details.
The rest of this lab is pictured using Mac OSX, but it is assumed you have enough knowledge of your Linux or Windows systems to be able to achieve the same results. Also note that you can run this workshop using Docker, but let's you sort out the details.
Prometheus - Verifying tooling installation
To start with a working container installation, you should see the following results for the
commands shown (note versions shown might differ for you):
							$ podman -v
podman version 5.x  <<<< MINIMUM VERSION REQUIRED

$ podman machine init
Downloading VM image: fedora-coreos-38.20230625.2.0-qemu.aarch64.qcow2.xz: done
Extracting compressed file
Image resized.
Machine init complete

$ podman machine start
Starting machine "podman-machine-default"
...
  (more console output...)
...
Machine "podman-machine-default" started successfully

$ podman machine list
NAME                     VM TYPE     CREATED     LAST UP            CPUS
podman-machine-default*  qemu        2 days ago  Currently running  1
Now that you have the tooling, let's get started installing Prometheus in a container...
Installation - Make a project directory
The first step will be to open a console or terminal window and start with the command line
to create yourself an empty workshop directory, something like this:
							$ mkdir workshop-prometheus

$ cd workshop-prometheus
Setup - A workshop configuration
Using any editor you like, create a file named
workshop-prometheus.yml and you are
going to create a basic Prometheus configuration that looks like the YAML code below which you
can cut-and-paste (be sure to save the results):
							# workshop config
global:
  scrape_interval: 5s

# Scraping only Prometheus.
scrape_configs:
  - job_name: "prometheus"
    static_configs:
      - targets: ["localhost:9090"]
Configuration - Some thoughts on setup
Normally you are monitoring other targets over HTTP and scraping their endpoints, but we are
going to start with Prometheus as it also exposes its own metrics endpoints. Monitoring your
Prometheus servers health is only an exercise for this workshop. Also note that scraping metrics
every 5 seconds is a bit over the top, commonly you would see 10-60 seconds, but we want our
data to flow in a steady stream for this workshop.
Configuration - The global section
As you can imagine, the
global section is used for settings and default
values. Here we have just set the default scrape interval to be 5 seconds:
							# workshop config
global:
  scrape_interval: 5s
Configuration - The scrape configs section
The
scrape_configs section is where you tell Prometheus which targets to
scrape to collect metrics from. In the beginning we will be listing each job for our targets
manually, using a host:port format:
							# Scraping only Prometheus.
scrape_configs:
  - job_name: "prometheus"
    static_configs:
      - targets: ["localhost:9090"]
Note: production configurations would use service discovery integrations to find targets, more
on that later in this workshop.
Installation - Creating container build file
Next you can use any editor you like, but create a file called
Buildfile
with the following which you can use through cut-and-pasting:
							FROM prom/prometheus:v3.0.1
ADD workshop-prometheus.yml /etc/prometheus
Installation - Building a container image
Now you can build your own container image with our custom configuration inserted:
							$ podman build -t workshop-prometheus:v3.0 -f Buildfile

STEP 1/2: FROM prom/prometheus:v3.0.1
Resolving "prom/prometheus"
Trying to pull docker.io/prom/prometheus:v3.0.1...
Getting image source signatures
Copying blob sha256:bd0d00e6784783d31bbe04e7b3bf2f54478ed0c46afc05a63e4a0f1f72076f03
Copying blob sha256:fcd10bff2ba698a61831db119b3e42b946a2007e735a1c2368233950ac183c44
Copying config sha256:57847a717fc6727452cd1ed5b02200e3030aba04ca13cbdc536ee99402643440
Writing manifest to image destination
STEP 2/2: ADD workshop-prometheus.yml /etc/prometheus
COMMIT workshop-prometheus:v3.0
--> 5f9686c89150
Successfully tagged localhost/workshop-prometheus:v3.0
5f9686c8915085b26a6793f249d369022fca6237547c280a2eb968da94586ecb
Installation - Verifying built image
Looking at the
IMAGES we see the following:
							$ podman images

REPOSITORY                     TAG         IMAGE ID      CREATED        SIZE
localhost/workshop-prometheus  v3.0       df411b583ae4   2 minutes ago  270 MB
docker.io/prom/prometheus      v3.0.1     4336a50d4ad9   12 days ago    270 MB
Prometheus - Start your metrics engines!
Now it's time to start the Prometheus server. We will point to our config file inside the image
we built using a flag (scroll to view log):
							$ podman run -p 9090:9090 workshop-prometheus:v3.0 --config.file=/etc/prometheus/workshop-prometheus.yml

time=2024-12-11T14:15:16.079Z level=INFO source=main.go:642 msg="No time or size retention was set so using the default time retention" duration=15d
time=2024-12-11T14:15:16.080Z level=INFO source=main.go:689 msg="Starting Prometheus Server" mode=server version="(version=3.0.1, branch=HEAD, revision=1f56e8492c31a558ccea833027db4bd7f8b6d0e9)"
time=2024-12-11T14:15:16.080Z level=INFO source=main.go:694 msg="operational information" build_context="(go=go1.23.3, platform=linux/arm64, user=root@9c13055ffc3c, date=20241128-17:23:49, tags=netgo,builtinassets,stringlabels)" host_details="(Linux 6.11.3-200.fc40.aarch64 #1 SMP PREEMPT_DYNAMIC Thu Oct 10 22:53:48 UTC 2024 aarch64 4aae79dd22d9 (none))" fd_limits="(soft=1048576, hard=1048576)" vm_limits="(soft=unlimited, hard=unlimited)"
time=2024-12-11T14:15:16.080Z level=INFO source=main.go:770 msg="Leaving GOMAXPROCS=4: CPU quota undefined" component=automaxprocs
time=2024-12-11T14:15:16.082Z level=INFO source=web.go:650 msg="Start listening for connections" component=web address=0.0.0.0:9090
time=2024-12-11T14:15:16.083Z level=INFO source=main.go:1239 msg="Starting TSDB ..."
time=2024-12-11T14:15:16.085Z level=INFO source=tls_config.go:347 msg="Listening on" component=web address=[::]:9090
time=2024-12-11T14:15:16.085Z level=INFO source=tls_config.go:350 msg="TLS is disabled." component=web http2=false address=[::]:9090
time=2024-12-11T14:15:16.086Z level=INFO source=head.go:628 msg="Replaying on-disk memory mappable chunks if any" component=tsdb
time=2024-12-11T14:15:16.086Z level=INFO source=head.go:715 msg="On-disk memory mappable chunks replay completed" component=tsdb duration=750ns
time=2024-12-11T14:15:16.086Z level=INFO source=head.go:723 msg="Replaying WAL, this may take a while" component=tsdb
time=2024-12-11T14:15:16.086Z level=INFO source=head.go:795 msg="WAL segment loaded" component=tsdb segment=0 maxSegment=0
time=2024-12-11T14:15:16.086Z level=INFO source=head.go:832 msg="WAL replay completed" component=tsdb checkpoint_replay_duration=10.667µs wal_replay_duration=238.168µs wbl_replay_duration=41ns chunk_snapshot_load_duration=0s mmap_chunk_replay_duration=750ns total_replay_duration=278.293µs
time=2024-12-11T14:15:16.088Z level=INFO source=main.go:1260 msg="filesystem information" fs_type=XFS_SUPER_MAGIC
time=2024-12-11T14:15:16.088Z level=INFO source=main.go:1263 msg="TSDB started"
time=2024-12-11T14:15:16.088Z level=INFO source=main.go:1446 msg="Loading configuration file" filename=/etc/prometheus/workshop-prometheus.yml
time=2024-12-11T14:15:16.089Z level=INFO source=main.go:1485 msg="updated GOGC" old=100 new=75
time=2024-12-11T14:15:16.089Z level=INFO source=main.go:1495 msg="Completed loading of configuration file" db_storage=709ns remote_storage=666ns web_handler=250ns query_engine=666ns scrape=449.377µs scrape_sd=19.333µs notify=1µs notify_sd=709ns rules=1.25µs tracing=19.416µs filename=/etc/prometheus/workshop-prometheus.yml totalDuration=748.877µs
time=2024-12-11T14:15:16.089Z level=INFO source=main.go:1224 msg="Server is ready to receive web requests."
time=2024-12-11T14:15:16.089Z level=INFO source=manager.go:168 msg="Starting rule manager..." component="rule manager"
Prometheus - Adjusting settings live
Using this container image we built means any changes you need to make to the configuration
that were in the flags used to start the server will require a new image be built, the old
container stopped, and the new container started using the new image.
Now let's see if our Prometheus server is up and running on our local machine by loading the status page in our browser at http://localhost:9090, noting it needs to run a little bit to collect some data from its own HTTP metrics endpoint.
Now let's see if our Prometheus server is up and running on our local machine by loading the status page in our browser at http://localhost:9090, noting it needs to run a little bit to collect some data from its own HTTP metrics endpoint.
Prometheus - The status page

Now try the dark mode feature by clicking on the half moon icon in the top right corner.
Prometheus - Status page (dark mode)

Now try the metrics endpoint
(http://localhost:9090/metrics)
directly in your browser.
Prometheus - Live metrics endpoint

Prometheus - Checking your targets
After you configure a new
prometheus target to scrape and (re)start the
Prometheus server, validate it's running correctly by going to the status page, using the
drop down menu at the top labeled STATUS and selecting
TARGETS:

Prometheus - Checking your targets
This shows you a list of the targets, in our case just one, featuring the scrape configuration
details. The most important field here is the
STATE, where we want to see a
green UP:

Prometheus - Bad target state
Let's break our configuration and see what that looks like in the targets status page. To do this
open up your configuration file
workshop-prometheus.yml and edit the
scrape_configs section to alter the targets port number as shown:
							# Scraping only Prometheus.
scrape_configs:
  - job_name: "prometheus"
    static_configs:
      - targets: ["localhost:9099"]
Save and see next slide for applying the new configuration.
Installation - Building a new container image
Now you can rebuild your own container image with our broken configuration inserted:
							$ podman build -t workshop-prometheus:bad-target -f Buildfile

STEP 1/2: FROM prom/prometheus:v3.0.1
STEP 2/2: ADD workshop-prometheus.yml /etc/prometheus
COMMIT workshop-prometheus
--> b63d3b6d2139
Successfully tagged localhost/workshop-prometheus:bad-target
b63d3b6d2139c3a28eeab4b8d65169a1b4d77da503c51a587340e0a1b0a52b8a
Installation - Verifying rebuilt image
Looking at the
IMAGES we see it was rebuilt just a bit ago, moving the older
image out of the way:
							$ podman images

REPOSITORY                     TAG         IMAGE ID      CREATED             SIZE
localhost/workshop-prometheus  bad-target  00d6552169cf  2 minutes ago       288 MB
localhost/workshop-prometheus  v3.0       d53a1e8ff3dc   7 minutes ago       288 MB
docker.io/prom/prometheus      v3.0.1     eb8939d5c174   12 days ago         288 MB
Prometheus - Start your broken configuration
First you stop the running container (using CTRL-C as we are not running the container detached),
then start it again as we did before, but this time the newest rebuilt image will be used:
							$ podman run -p 9090:9090 workshop-prometheus:bad-target --config.file=/etc/prometheus/workshop-prometheus.yml

time=2024-12-11T14:15:16.079Z level=INFO source=main.go:642 msg="No time or size retention was set so using the default time retention" duration=15d
time=2024-12-11T14:15:16.080Z level=INFO source=main.go:689 msg="Starting Prometheus Server" mode=server version="(version=3.0.1, branch=HEAD, revision=1f56e8492c31a558ccea833027db4bd7f8b6d0e9)"
time=2024-12-11T14:15:16.080Z level=INFO source=main.go:694 msg="operational information" build_context="(go=go1.23.3, platform=linux/arm64, user=root@9c13055ffc3c, date=20241128-17:23:49, tags=netgo,builtinassets,stringlabels)" host_details="(Linux 6.11.3-200.fc40.aarch64 #1 SMP PREEMPT_DYNAMIC Thu Oct 10 22:53:48 UTC 2024 aarch64 4aae79dd22d9 (none))" fd_limits="(soft=1048576, hard=1048576)" vm_limits="(soft=unlimited, hard=unlimited)"
time=2024-12-11T14:15:16.080Z level=INFO source=main.go:770 msg="Leaving GOMAXPROCS=4: CPU quota undefined" component=automaxprocs
time=2024-12-11T14:15:16.082Z level=INFO source=web.go:650 msg="Start listening for connections" component=web address=0.0.0.0:9090
time=2024-12-11T14:15:16.083Z level=INFO source=main.go:1239 msg="Starting TSDB ..."
time=2024-12-11T14:15:16.085Z level=INFO source=tls_config.go:347 msg="Listening on" component=web address=[::]:9090
time=2024-12-11T14:15:16.085Z level=INFO source=tls_config.go:350 msg="TLS is disabled." component=web http2=false address=[::]:9090
time=2024-12-11T14:15:16.086Z level=INFO source=head.go:628 msg="Replaying on-disk memory mappable chunks if any" component=tsdb
time=2024-12-11T14:15:16.086Z level=INFO source=head.go:715 msg="On-disk memory mappable chunks replay completed" component=tsdb duration=750ns
time=2024-12-11T14:15:16.086Z level=INFO source=head.go:723 msg="Replaying WAL, this may take a while" component=tsdb
time=2024-12-11T14:15:16.086Z level=INFO source=head.go:795 msg="WAL segment loaded" component=tsdb segment=0 maxSegment=0
time=2024-12-11T14:15:16.086Z level=INFO source=head.go:832 msg="WAL replay completed" component=tsdb checkpoint_replay_duration=10.667µs wal_replay_duration=238.168µs wbl_replay_duration=41ns chunk_snapshot_load_duration=0s mmap_chunk_replay_duration=750ns total_replay_duration=278.293µs
time=2024-12-11T14:15:16.088Z level=INFO source=main.go:1260 msg="filesystem information" fs_type=XFS_SUPER_MAGIC
time=2024-12-11T14:15:16.088Z level=INFO source=main.go:1263 msg="TSDB started"
time=2024-12-11T14:15:16.088Z level=INFO source=main.go:1446 msg="Loading configuration file" filename=/etc/prometheus/workshop-prometheus.yml
time=2024-12-11T14:15:16.089Z level=INFO source=main.go:1485 msg="updated GOGC" old=100 new=75
time=2024-12-11T14:15:16.089Z level=INFO source=main.go:1495 msg="Completed loading of configuration file" db_storage=709ns remote_storage=666ns web_handler=250ns query_engine=666ns scrape=449.377µs scrape_sd=19.333µs notify=1µs notify_sd=709ns rules=1.25µs tracing=19.416µs filename=/etc/prometheus/workshop-prometheus.yml totalDuration=748.877µs
time=2024-12-11T14:15:16.089Z level=INFO source=main.go:1224 msg="Server is ready to receive web requests."
time=2024-12-11T14:15:16.089Z level=INFO source=manager.go:168 msg="Starting rule manager..." component="rule manager"
Prometheus - Verify bad target state
Back to the target state page and we see that indeed the target we configured is broken:

Exercise: go back and fix this target before proceeding!
Prometheus - Exploring command-line flags
When you started Prometheus we mentioned a flag to point at our new configuration file. There is
a status page you can use to view all the flags that have been set (by your or default settings).
Using the drop down menu again at the top labeled
STATUS and selecting
COMMAND-LINE FLAGS:

Prometheus - Exploring command-line flags
This shows you a long list of flags with their current values and a search field for locating
one you might be interested in:
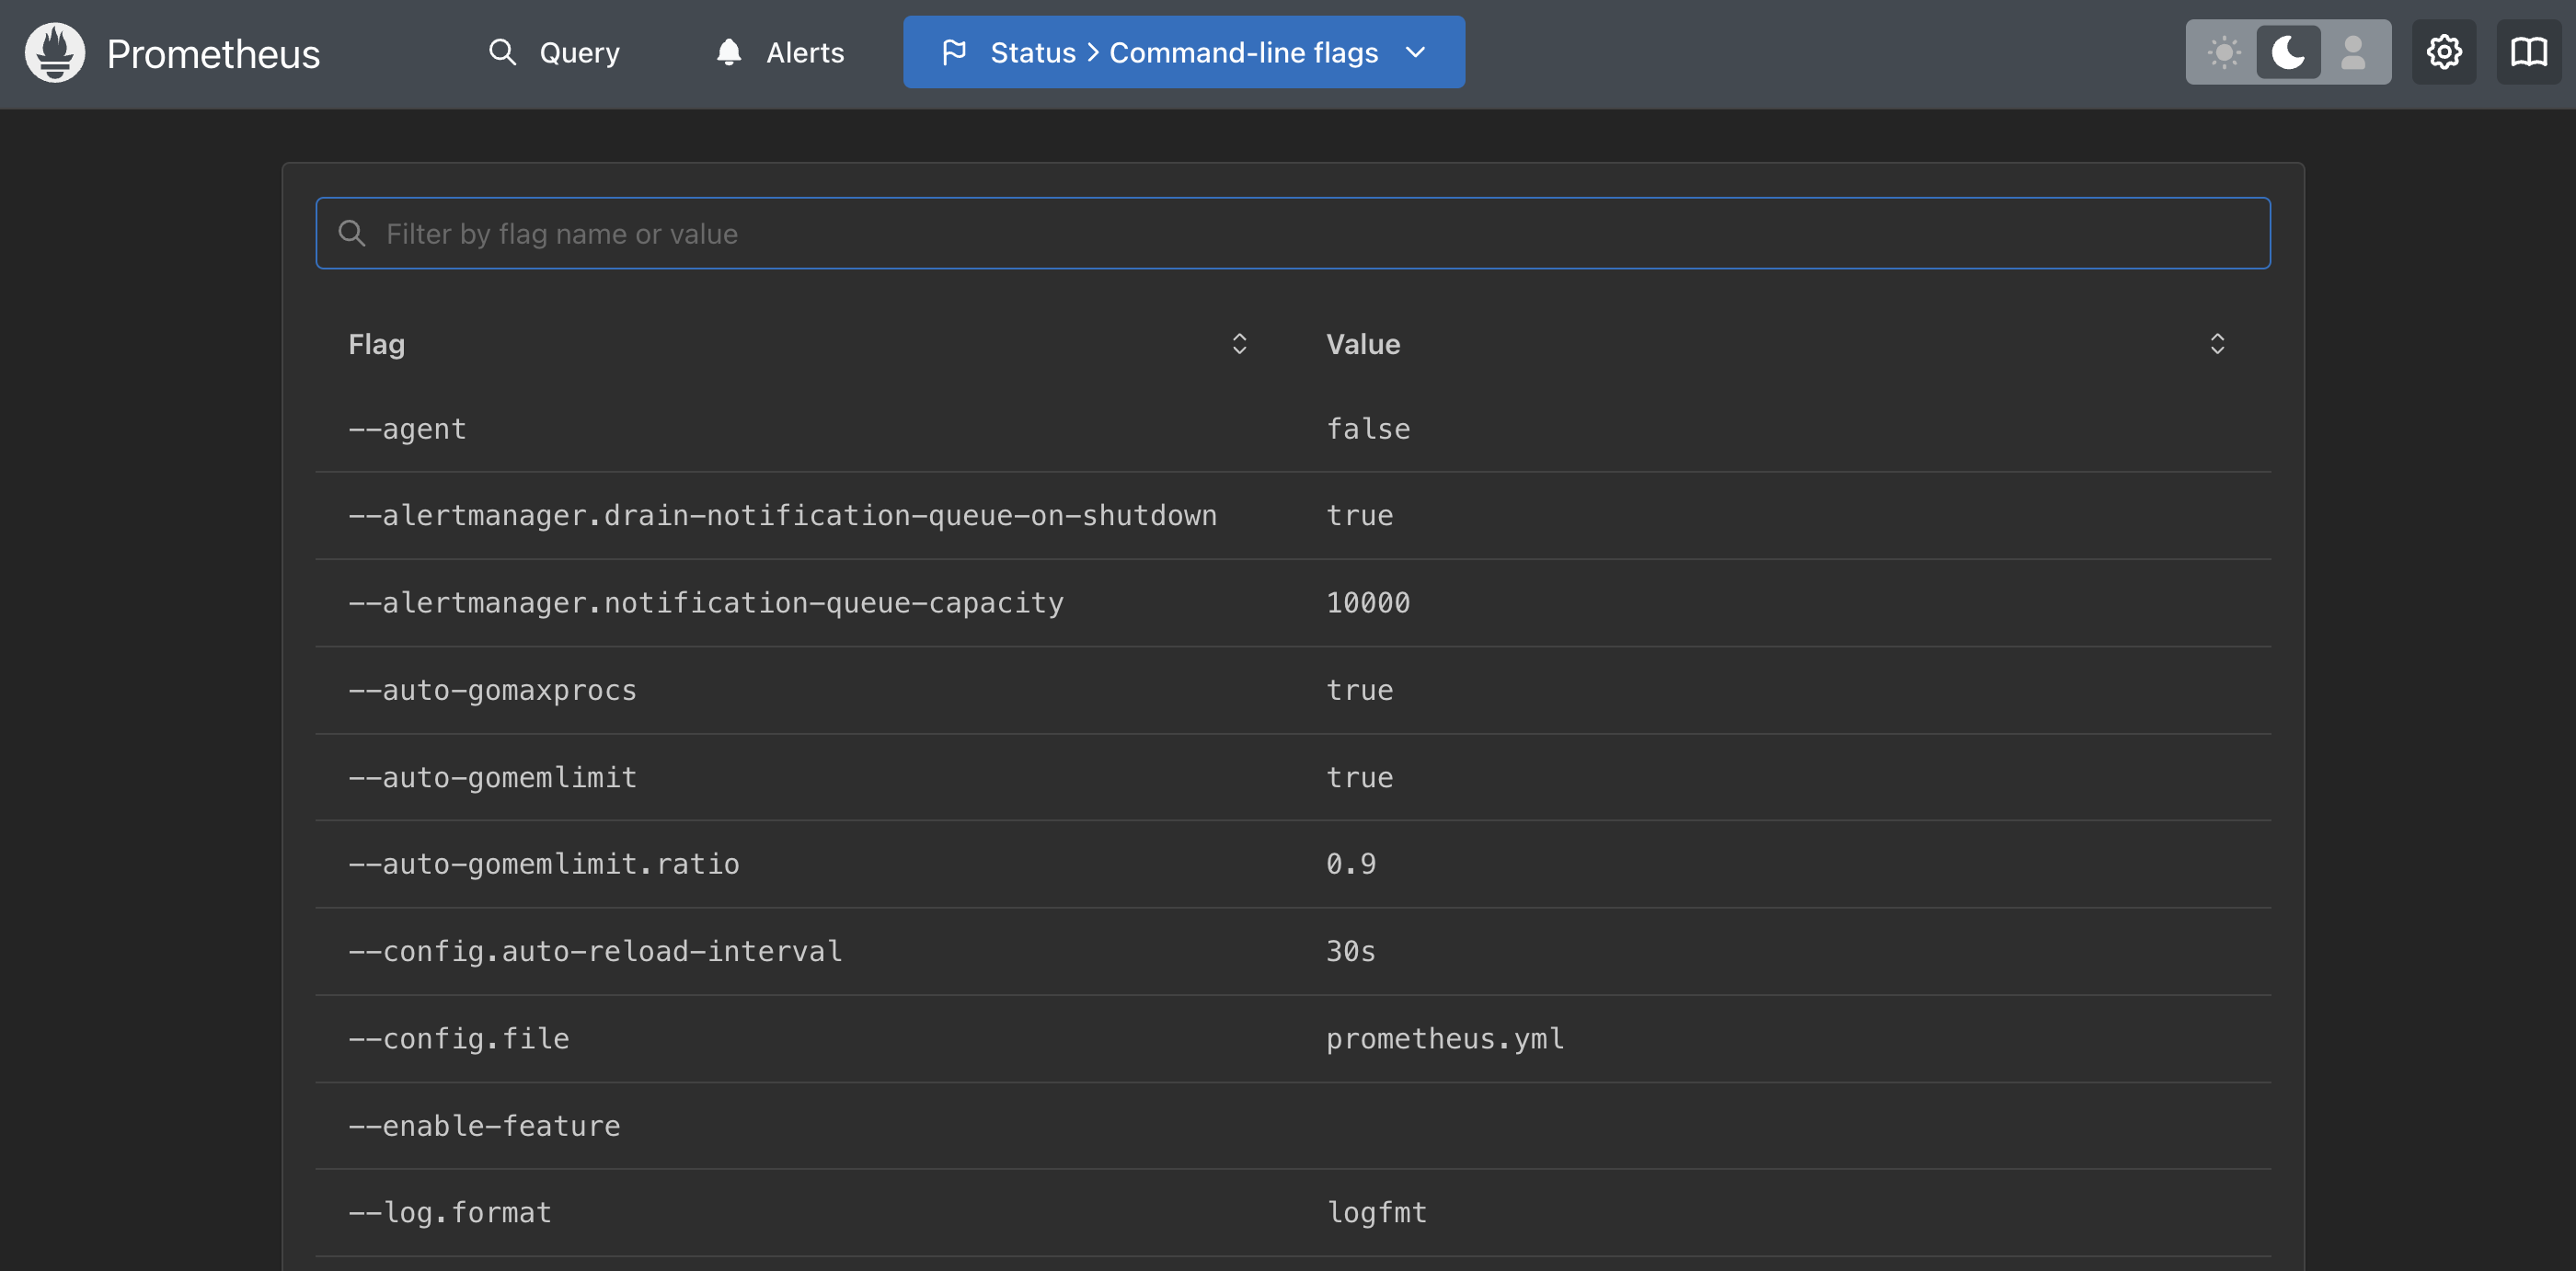
Prometheus - Searching for a flag
By filling in a search query, you can narrow down the long list to a specific area. Let's
explore the flag value for
--config.file:

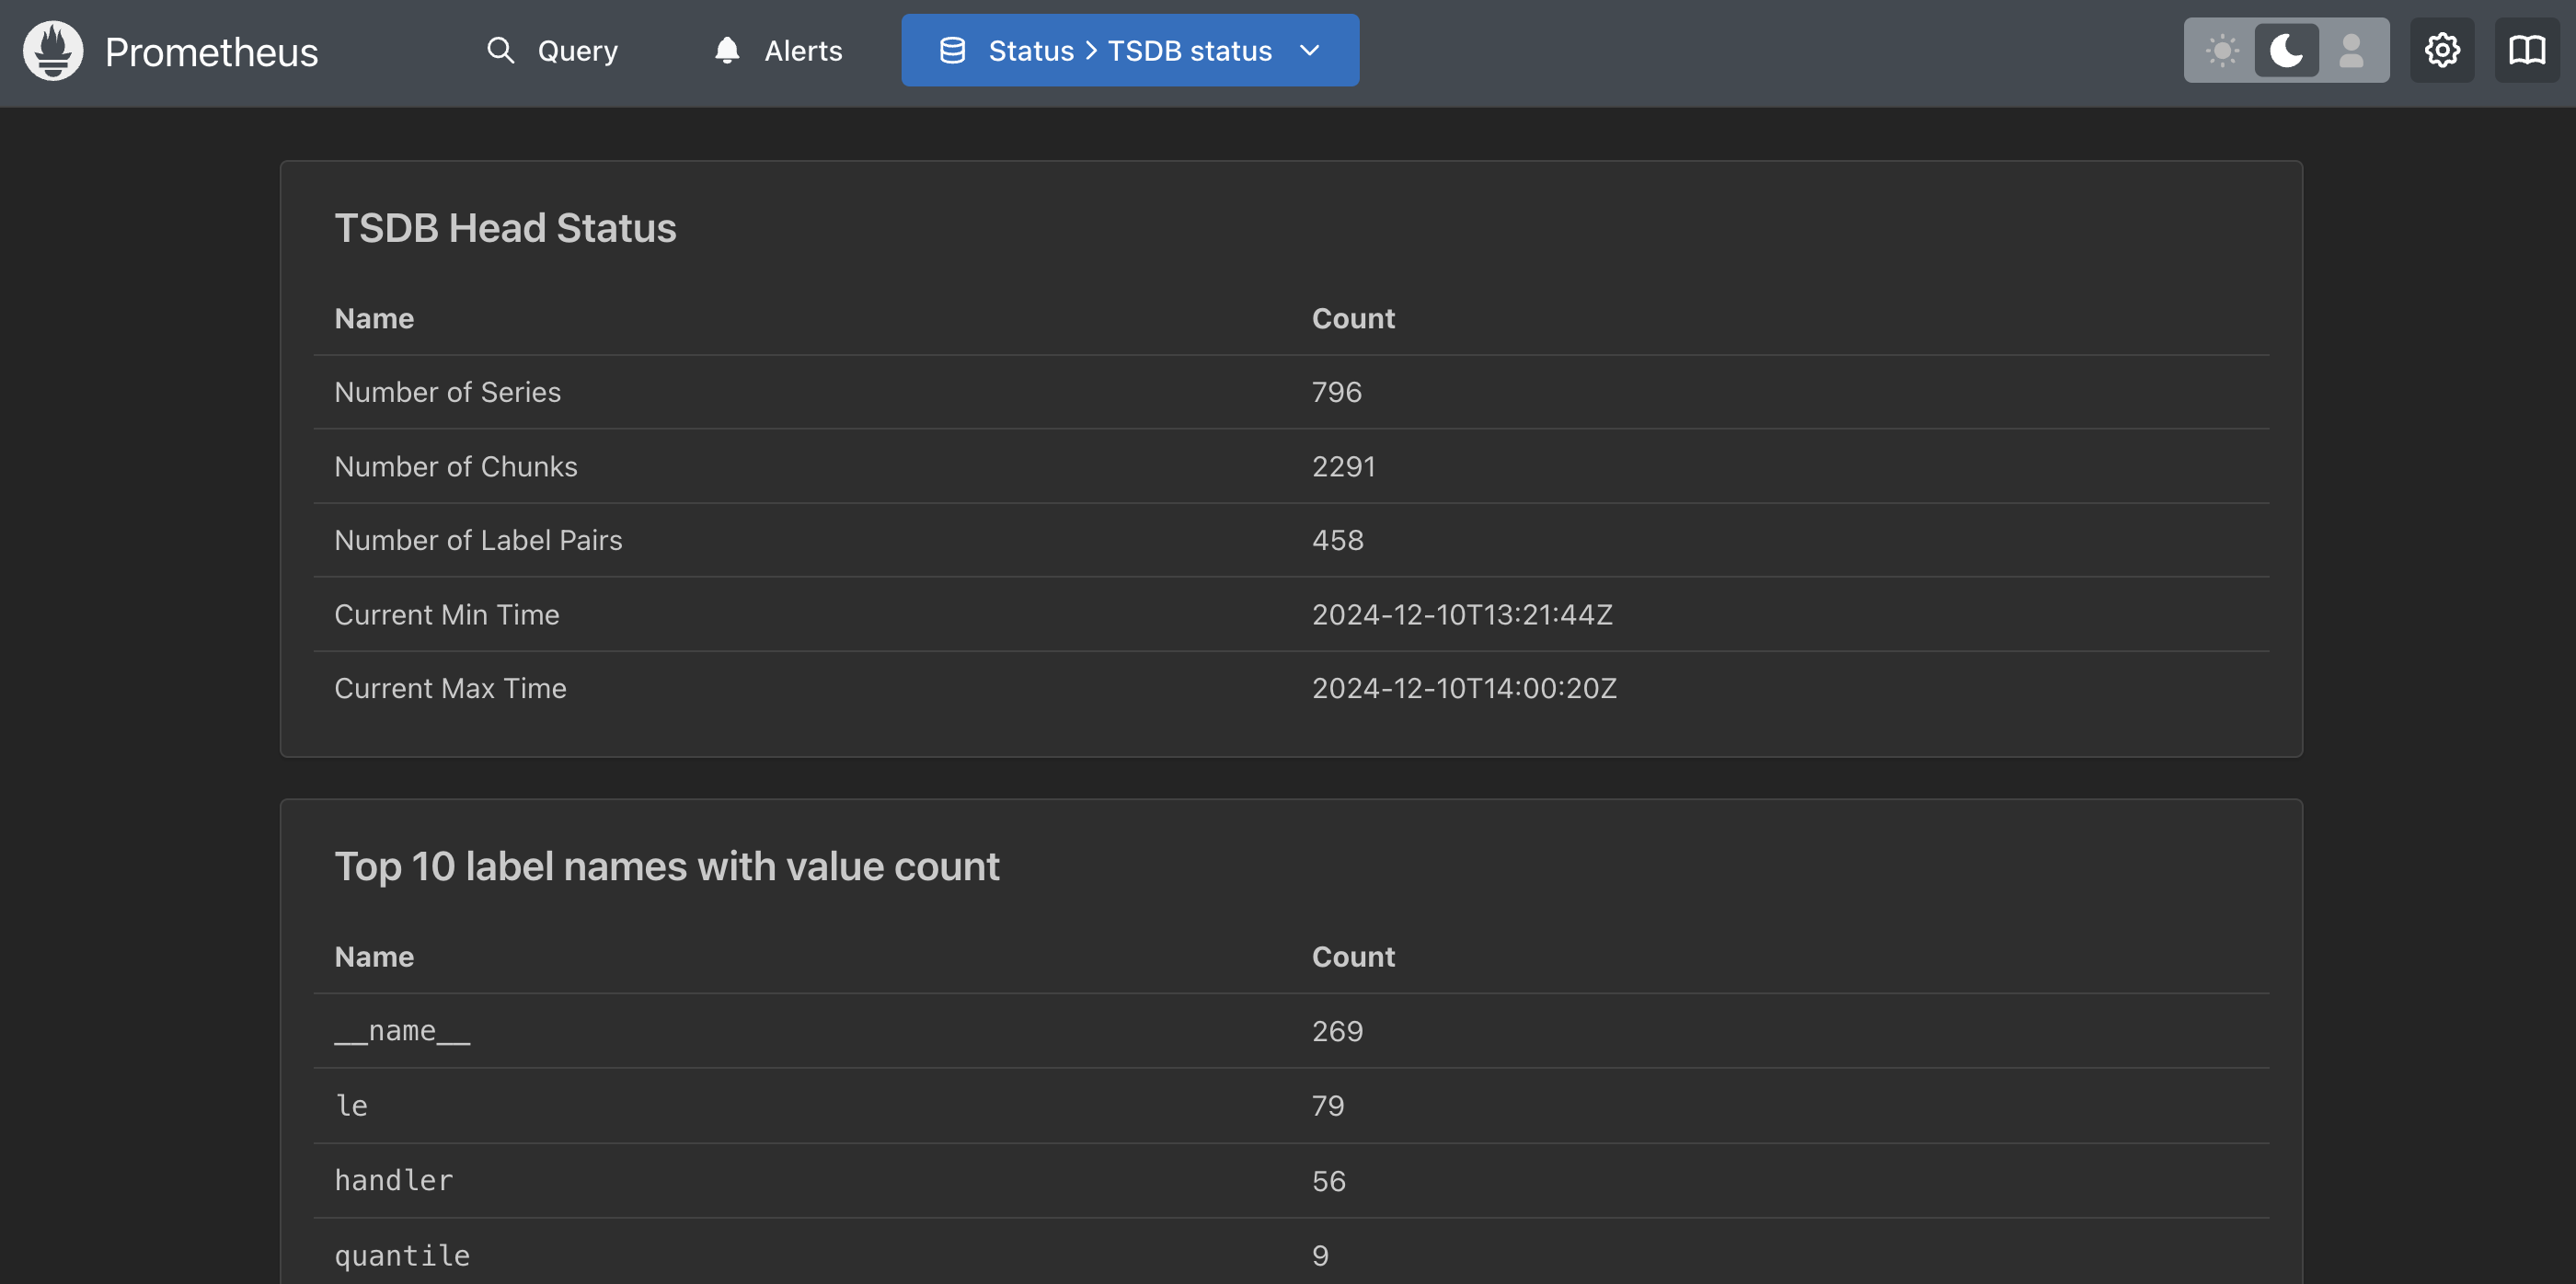
Prometheus - Time series database status
Next, there is a status page you can use to view your time series database, or TSDB, status.
Using the drop down menu again at the top labeled
STATUS and selecting
TSDB-STATUS:

Prometheus - Time series database status
This shows you some details for the time series being collected in an overview status line with
several tables below with cardinality status:
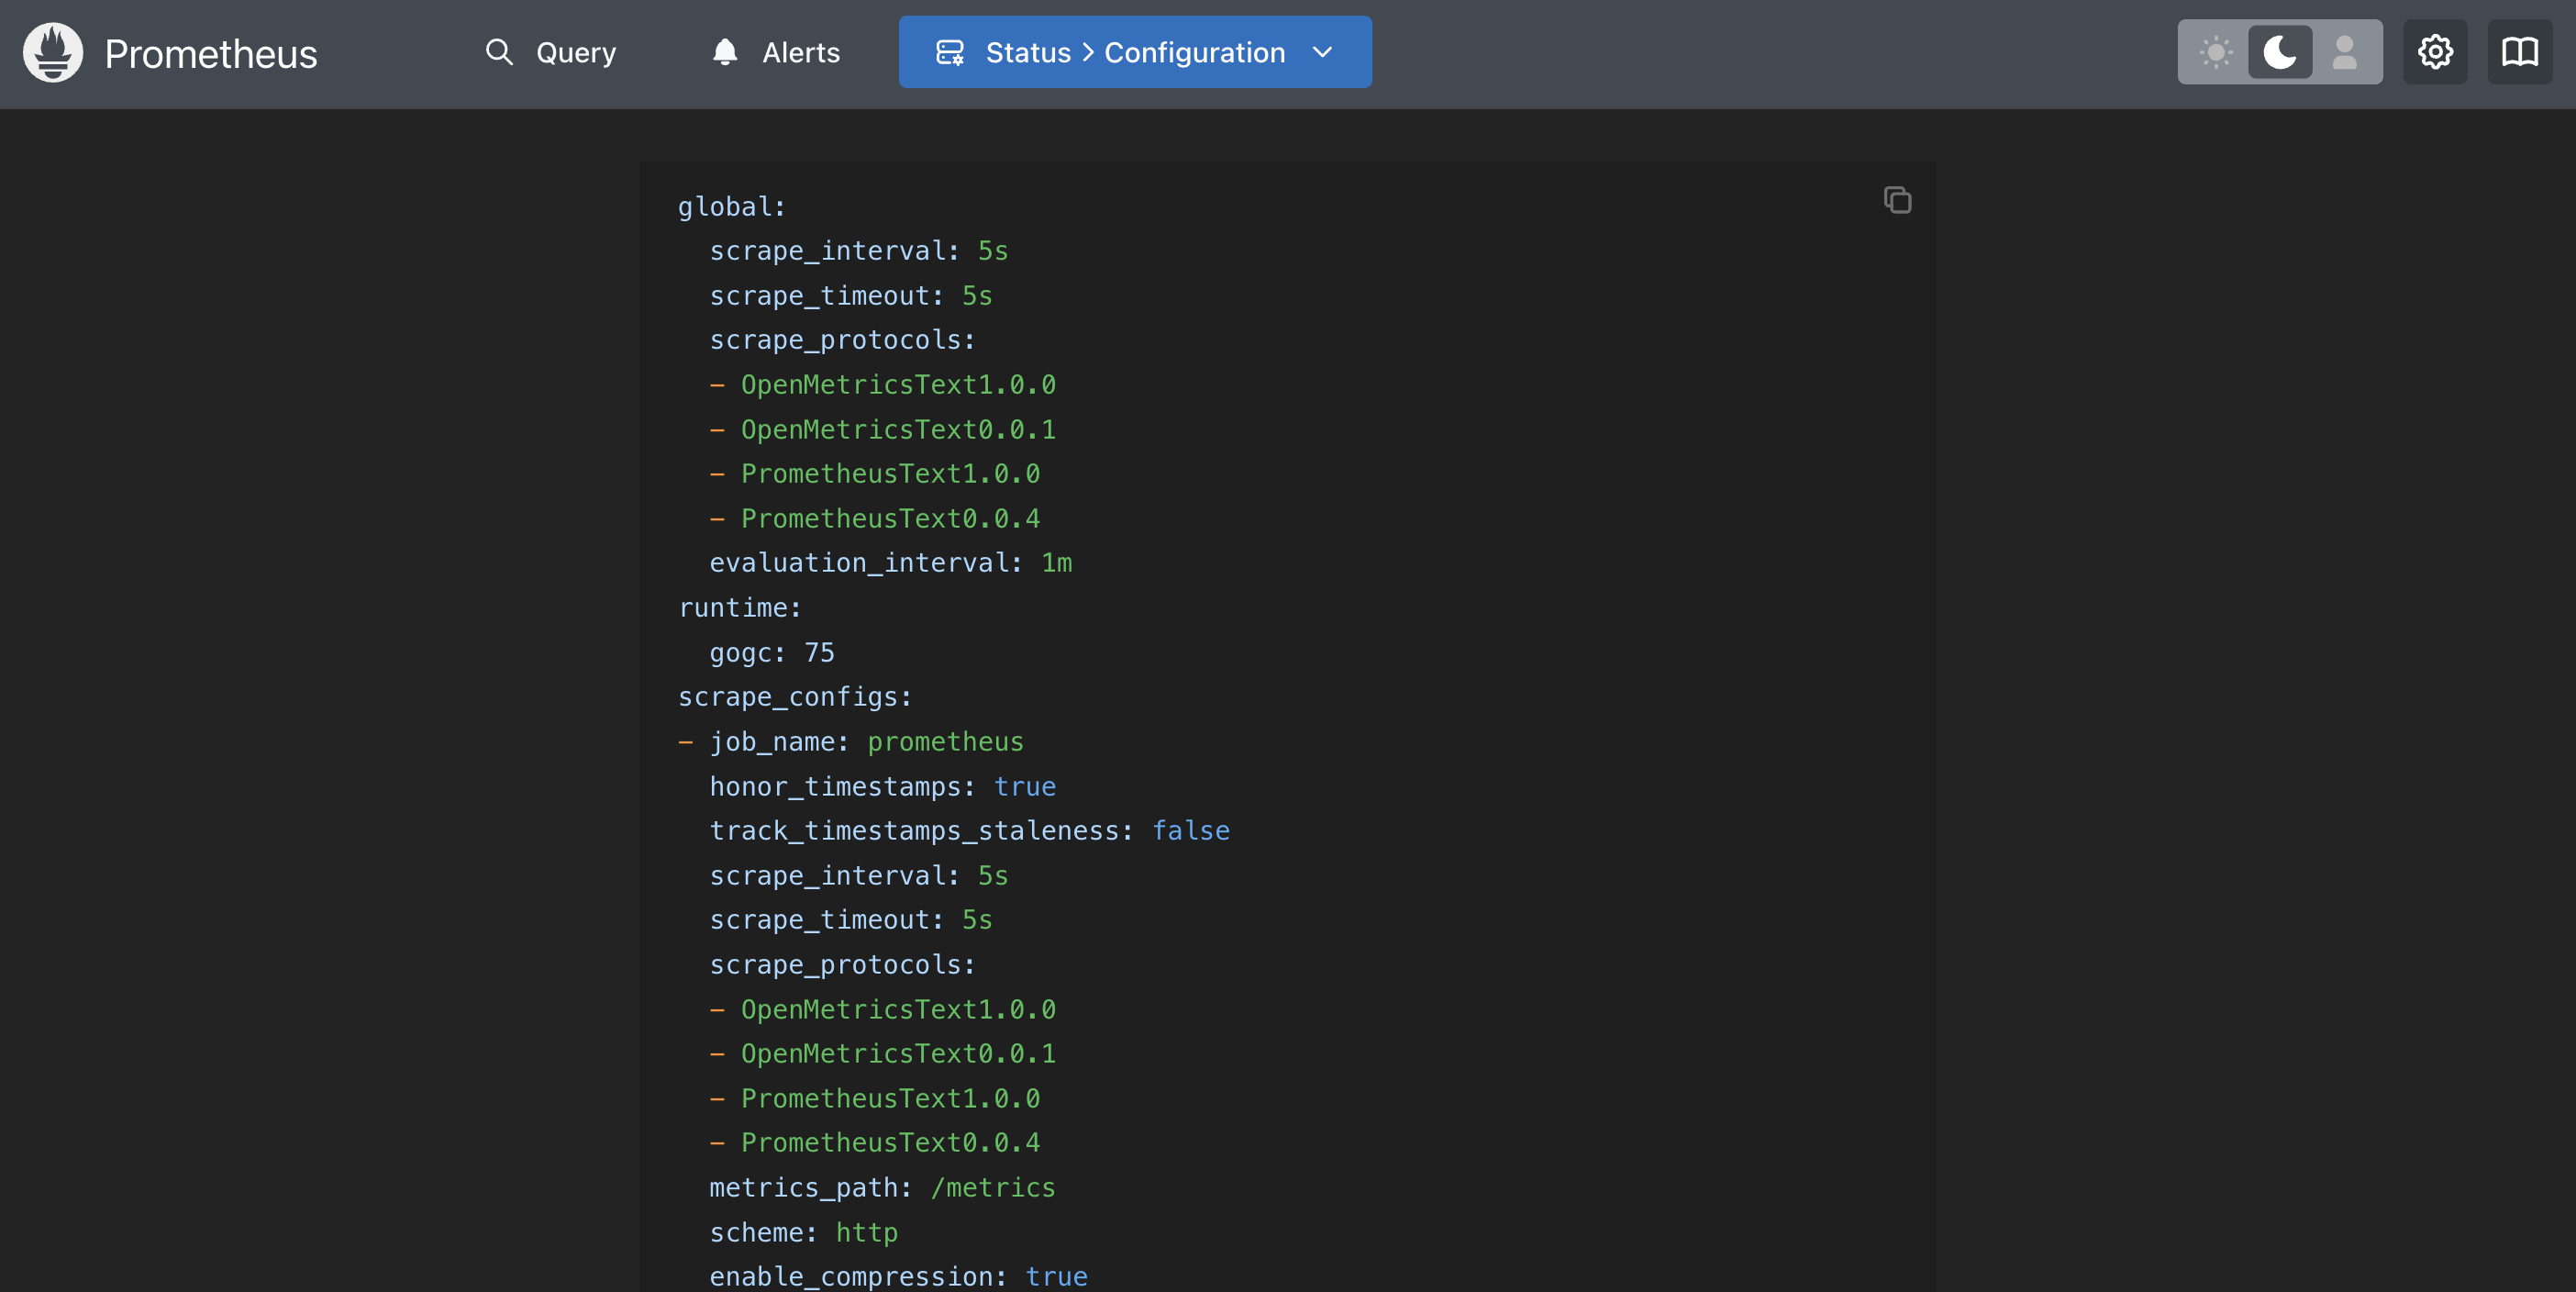
Prometheus - Exploring active configuration
Lastly, at least in this lab, you can verify the exact configuration being applied to your
Prometheus server. Using the drop down menu again at the top labeled
STATUS
and selecting CONFIGURATION:

Prometheus - Exploring active configuration
This shows you your exact configuration, often including some defaults that you might not have
in your personal configuration file, yet are begin used. There is even a handy copy-to-clipboard
button for you to grab it:
Prometheus - Using the expression tooling
You can navigate back to the expression browser that let's you query your time series data
by clicking on the menu entry
GRAPH. This is the default built-in query
interface for running Prometheus Query Language (PromQL) queries. Be sure you are in the
TABLE tab:

Prometheus - Total samples ingested
The
TABLE view provides the output of a query written using PromQL expression as
a series. It's less expensive to use than the other option, GRAPH, because you are
not plotting out the series answers in a graph. Without worrying about the PromQL used (we'll
explore that later in this workshop), lets show the total number of samples ingested by our
Prometheus server since it started:
							# Copy this line below comments into the Expression field and
# click on the EXECUTE button on the right side of the screen.
#
prometheus_tsdb_head_samples_appended_total
Prometheus - Validating an expression
You will have noticed that there are three buttons to the right of the
EXPRESSION entry field. The first one can be used to validate the expression
you entered, just click and if it's a good expression you get a checkmark. Enter the previous
slides expression and click on the first button to generate a checkmark:

Prometheus - Execute the expression query
After validating our expression, run it by clicking on the
EXECUTE button:

Prometheus - Exploring the visualization
Let's explore by clicking on the
GRAPH tab. Note the features included to
visualize queries. I have adjusted my longer running server to look at 12h of data here and
am browsing the results:

Prometheus - Add another query
Go back to the
TABLE tab. Notice at the bottom there is a button
ADD QUERY, click on it to add another query panel in which we will execute
the following query expression. Let's look at the number of samples ingested per second averaged
over a 1m window of time:
							# Copy this line below comments into the Expression field and
# click on the EXECUTE button on the right side of the screen.
#
rate(prometheus_tsdb_head_samples_appended_total[1m])
Prometheus - Execute the second query
You can now see multiple expressions are possible:

Prometheus - Exploring second visualization

Intermezzo - Warning about pages
If you now select any of the status pages from the
Pro tip: you might want to work using browser tabs.
STATUS menu at the top and
then return to the expression query page using the GRAPH menu entry, you will
notice that extra panels you might have added will be gone.Pro tip: you might want to work using browser tabs.
Prometheus - One last query
Assuming you went to another status page and back, we have a last query we will run here to
simulate the same query used to fill the system UP metric we viewed for our Prometheus target:
							# Copy this line below comments into the Expression field and
# click on the EXECUTE button on the right side of the screen.
#
up{job="prometheus"}
Prometheus - Execute the second query
You can now see the results as a boolean value suggesting it is really UP:

Prometheus - Exploring this silly visualization
This is a rather silly metric to visualize this way, but this is what it looks like going back
over 1d as my server was running during this lab's development (you can check my working hours!):

Lab completed - Results
Next up, exploring the query language...

Contact - are there any questions?
Eric D. Schabell
Director Evangelism
Contact: @ericschabell {@fosstodon.org) or https://www.schabell.org
Director Evangelism
Contact: @ericschabell {@fosstodon.org) or https://www.schabell.org
Up next in workshop...
Lab 2 - Installing Prometheus (container image)