Lab 2 - Installing Prometheus (binary package)
Lab Goal
This lab guides you through installing Prometheus from a pre-compiled binary package on your local machine, configuring, and running it to start gathering metrics.
Prometheus - Installation notes
This lab guides you through installing Prometheus using one of the pre-compiled binaries. You
will see this done here for Mac OSX, but links will be provided for both Linux and Windows
systems. It is expected that if you are using either of these operating systems, that you have
enough knowledge to apply the steps from this guide using the specific system tooling provided
by your local machine.
Installation - Make a project directory
The first step will be to open a console or terminal window and start with the command line
to create yourself an empty workshop directory, something like this:
							$ mkdir workshop-prometheus

$ cd workshop-prometheus
Installation - Download Prometheus
Installation - Unpacking the binary
Unpacking the download should look something like this (note the version might
be different by the time you take this workshop):
							$ tar -xzvf prometheus-3.0.1.darwin-amd64.tar.gz

x prometheus-3.0.1.darwin-amd64/
x prometheus-3.0.1.darwin-amd64/promtool
x prometheus-3.0.1.darwin-amd64/LICENSE
x prometheus-3.0.1.darwin-amd64/prometheus
x prometheus-3.0.1.darwin-amd64/prometheus.yml
x prometheus-3.0.1.darwin-amd64/NOTICE
Installation - Exploring the tools
There are four items you just unpacked that are of interest to us:
prometheus- the binary executable for Prometheuspromtool- a command line configuration validation toolprometheus.yml- simple configuration to run Prometheus
We will be making the most use of the Prometheus binary and the basic configuration file in the rest of this workshop.
Setup - Copy basic configuration
First we will make a copy of the provided configuration file for use in the rest of this
workshop. We need to move into the Prometheus directory and then make the copy:
							$ cd prometheus-3.0.1.darwin-amd64

$ cp prometheus.yml workshop-prometheus.yml
Setup - Workshop configuration
Open the copied file
workshop-prometheus.yml and you should see a lot of comments
spread over the file (something like 25-30 lines). By default it's set up to scrape metrics
from itself every 15 seconds. Using your favorite editor, clean it up a bit so that it looks
like this (be sure to save the results):
							# workshop config
global:
  scrape_interval: 5s

# Scraping only Prometheus.
scrape_configs:
  - job_name: "prometheus"
    static_configs:
      - targets: ["localhost:9090"]
Configuration - Some thoughts on setup
Normally you are monitoring other targets over HTTP and scraping their endpoints, but we are
going to start with Prometheus as it also exposes its own metrics endpoints. Monitoring your
Prometheus servers' health is only an exercise for this workshop. Also note that scraping metrics
every 5 seconds is a bit over the top, commonly you would see 10-60 seconds, but we want our
data to flow in a steady stream for this workshop.
Configuration - The global section
As you can imagine, the
global section is used for settings and default values.
Here we have just set the default scrape interval to be 5 seconds:
							# workshop config
global:
  scrape_interval: 5s
Configuration - The scrape configs section
The
scrape_configs section is where you tell Prometheus which targets to scrape to
collect metrics from. In the beginning we will be listing each job for our targets manually,
using a host:port format:
							# Scraping only Prometheus.
scrape_configs:
  - job_name: "prometheus"
    static_configs:
      - targets: ["localhost:9090"]
Note: production configurations would use service discovery integrations to find targets, more
on that later in this workshop.
Prometheus - Start your metrics engines!
Now it's time to start the Prometheus server. We will point to our config file using a flag, if
you don't it's going to grab the default
prometheus.yml file. Also note, the in
memory database is stored by default in ./data. Note: might need to approve the
file in security settings if it fails to start. (scroll to view log):
							$ ./prometheus --config.file=workshop-prometheus.yml

...
time=2024-12-10T14:21:38.421+01:00 level=INFO source=main.go:642 msg="No time or size retention was set so using the default time retention" duration=15d
time=2024-12-10T14:21:38.422+01:00 level=INFO source=main.go:689 msg="Starting Prometheus Server" mode=server version="(version=3.0.1, branch=HEAD, revision=1f56e8492c31a558ccea833027db4bd7f8b6d0e9)"
time=2024-12-10T14:21:38.422+01:00 level=INFO source=main.go:694 msg="operational information" build_context="(go=go1.23.3, platform=darwin/amd64, user=root@6b1b3f1faf28, date=20241128-17:20:48, tags=netgo,builtinassets,stringlabels)" host_details=(darwin) fd_limits="(soft=61440, hard=unlimited)" vm_limits="(soft=unlimited, hard=unlimited)"
time=2024-12-10T14:21:38.423+01:00 level=INFO source=main.go:770 msg="Leaving GOMAXPROCS=8: CPU quota undefined" component=automaxprocs
time=2024-12-10T14:21:38.425+01:00 level=INFO source=web.go:650 msg="Start listening for connections" component=web address=0.0.0.0:9090
time=2024-12-10T14:21:38.426+01:00 level=INFO source=main.go:1239 msg="Starting TSDB ..."
time=2024-12-10T14:21:38.429+01:00 level=INFO source=tls_config.go:347 msg="Listening on" component=web address=[::]:9090
time=2024-12-10T14:21:38.429+01:00 level=INFO source=tls_config.go:350 msg="TLS is disabled." component=web http2=false address=[::]:9090
time=2024-12-10T14:21:38.432+01:00 level=INFO source=head.go:628 msg="Replaying on-disk memory mappable chunks if any" component=tsdb
time=2024-12-10T14:21:38.432+01:00 level=INFO source=head.go:715 msg="On-disk memory mappable chunks replay completed" component=tsdb duration=6.125µs
time=2024-12-10T14:21:38.432+01:00 level=INFO source=head.go:723 msg="Replaying WAL, this may take a while" component=tsdb
time=2024-12-10T14:21:38.433+01:00 level=INFO source=head.go:795 msg="WAL segment loaded" component=tsdb segment=0 maxSegment=0
time=2024-12-10T14:21:38.434+01:00 level=INFO source=head.go:832 msg="WAL replay completed" component=tsdb checkpoint_replay_duration=68µs wal_replay_duration=1.348666ms wbl_replay_duration=167ns chunk_snapshot_load_duration=0s mmap_chunk_replay_duration=6.125µs total_replay_duration=1.70275ms
time=2024-12-10T14:21:38.435+01:00 level=INFO source=main.go:1260 msg="filesystem information" fs_type=1a
time=2024-12-10T14:21:38.435+01:00 level=INFO source=main.go:1263 msg="TSDB started"
time=2024-12-10T14:21:38.435+01:00 level=INFO source=main.go:1446 msg="Loading configuration file" filename=prometheus.yml
time=2024-12-10T14:21:38.464+01:00 level=INFO source=main.go:1485 msg="updated GOGC" old=100 new=75
time=2024-12-10T14:21:38.464+01:00 level=INFO source=main.go:1495 msg="Completed loading of configuration file" db_storage=5.041µs remote_storage=2.167µs web_handler=459ns query_engine=1.875µs scrape=27.376291ms scrape_sd=32.084µs notify=2.167µs notify_sd=917ns rules=2.583µs tracing=125.541µs filename=prometheus.yml totalDuration=28.635708ms
time=2024-12-10T14:21:38.464+01:00 level=INFO source=main.go:1224 msg="Server is ready to receive web requests."
time=2024-12-10T14:21:38.464+01:00 level=INFO source=manager.go:168 msg="Starting rule manager..." component="rule manager"
Prometheus - Adjusting settings live
If you change settings in a configuration file from a live running Prometheus server, you can
apply them by sending a
Now let's see if our Prometheus server is up and running on our local machine by loading the status page in our browser at http://localhost:9090, noting it needs to run a little bit to collect some data from its own HTTP metrics endpoint.
HUP signal on your platform or by reloading via the HTTP
API. Any changes you need to make that were in the flags used to start the server will require
a full server restart to apply.Now let's see if our Prometheus server is up and running on our local machine by loading the status page in our browser at http://localhost:9090, noting it needs to run a little bit to collect some data from its own HTTP metrics endpoint.
Prometheus - The status page

Now try the dark mode feature by clicking on the half moon icon in the top right corner.
Prometheus - Status page (dark mode)

Now try the metrics endpoint
(http://localhost:9090/metrics)
directly in your browser.
Prometheus - Live metrics endpoint

Prometheus - Checking your targets
After you configure a new
prometheus target to scrape and (re)start the
Prometheus server, validate it's running correctly by going to the status page, using the
drop down menu at the top labeled STATUS and selecting
TARGETS:

Prometheus - Checking your targets
This shows you a list of the targets, in our case just one, featuring the scrape configuration
details. The most important field here is the
STATE, where we want to see a green
UP:

Prometheus - Bad target state
Let's break our configuration and see what that looks like in the targets status page. To do this
open up your configuration file
workshop-prometheus.yml and edit the
scrape_configs section to alter the targets port number as shown:
							# Scraping only Prometheus.
scrape_configs:
  - job_name: "prometheus"
    static_configs:
      - targets: ["localhost:9099"]
Save and see next slide for applying the new configuration.
Prometheus - Apply a new configuration
We mentioned you can restart the Prometheus, that is, stop it and then restart when a new
configuration needs to be applied. That's going to mean you lose a time period of collecting
time series data, so let's send a restart signal instead using the
kill
command. First we find the Prometheus server process id (PID) using one command, then apply it
using the command as shown below:
							# Locate the Prometheus process id (PID).
#
$ ps aux  | grep prometheus

erics  94110   1:31PM   0:05.28 ./prometheus --config.file=workshop-prometheus.yml
erics  97648   2:43PM   0:00.00 grep prometheus

# Send a restart signal to the PID we found.
#
$ kill -s HUP 94110
Prometheus - Verify bad target state
Back to the target state page and we see that indeed the target we configured is broken:

Exercise: go back and revert or fix this target and restart the instance before proceeding!
Prometheus - Exploring command-line flags
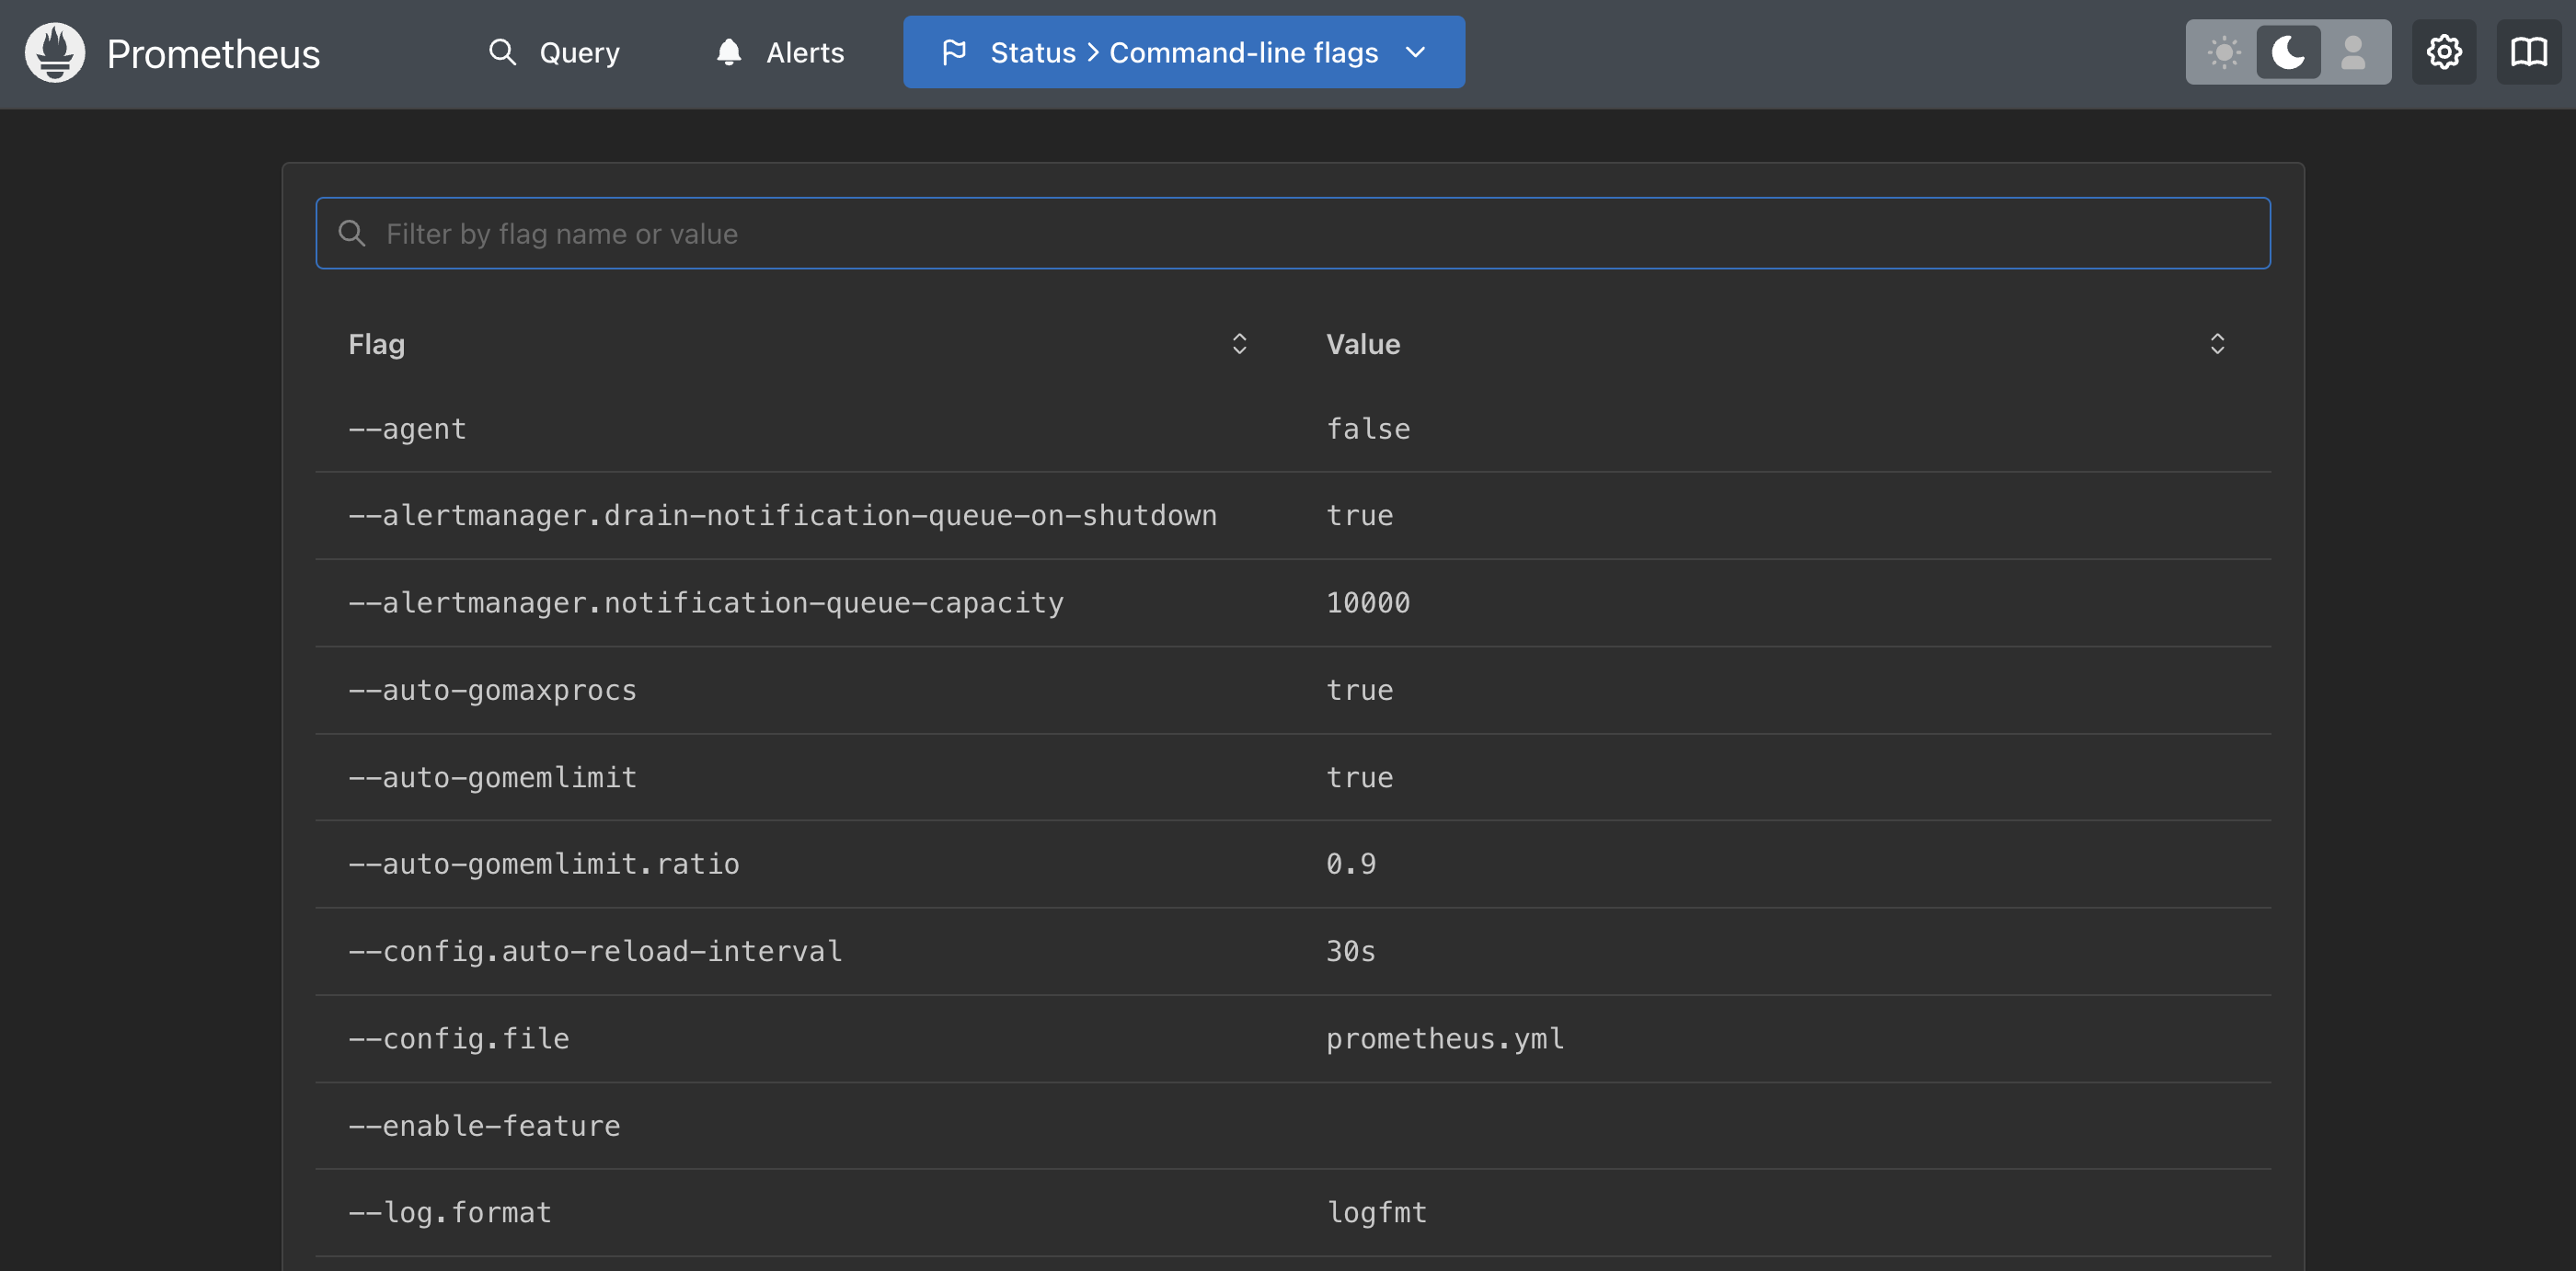
When you started Prometheus we mentioned a flag to point at our new configuration file. There is
a status page you can use to view all the flags that have been set (by your or default settings).
Using the drop down menu again at the top labeled
STATUS and selecting
COMMAND-LINE FLAGS:

Prometheus - Exploring command-line flags
This shows you a long list of flags with their current values and a search field for locating
one you might be interested in:

Prometheus - Searching for a flag
By filling in a search query, you can narrow down the long list to a specific area. Let's explore
the flag value for
--config.file:

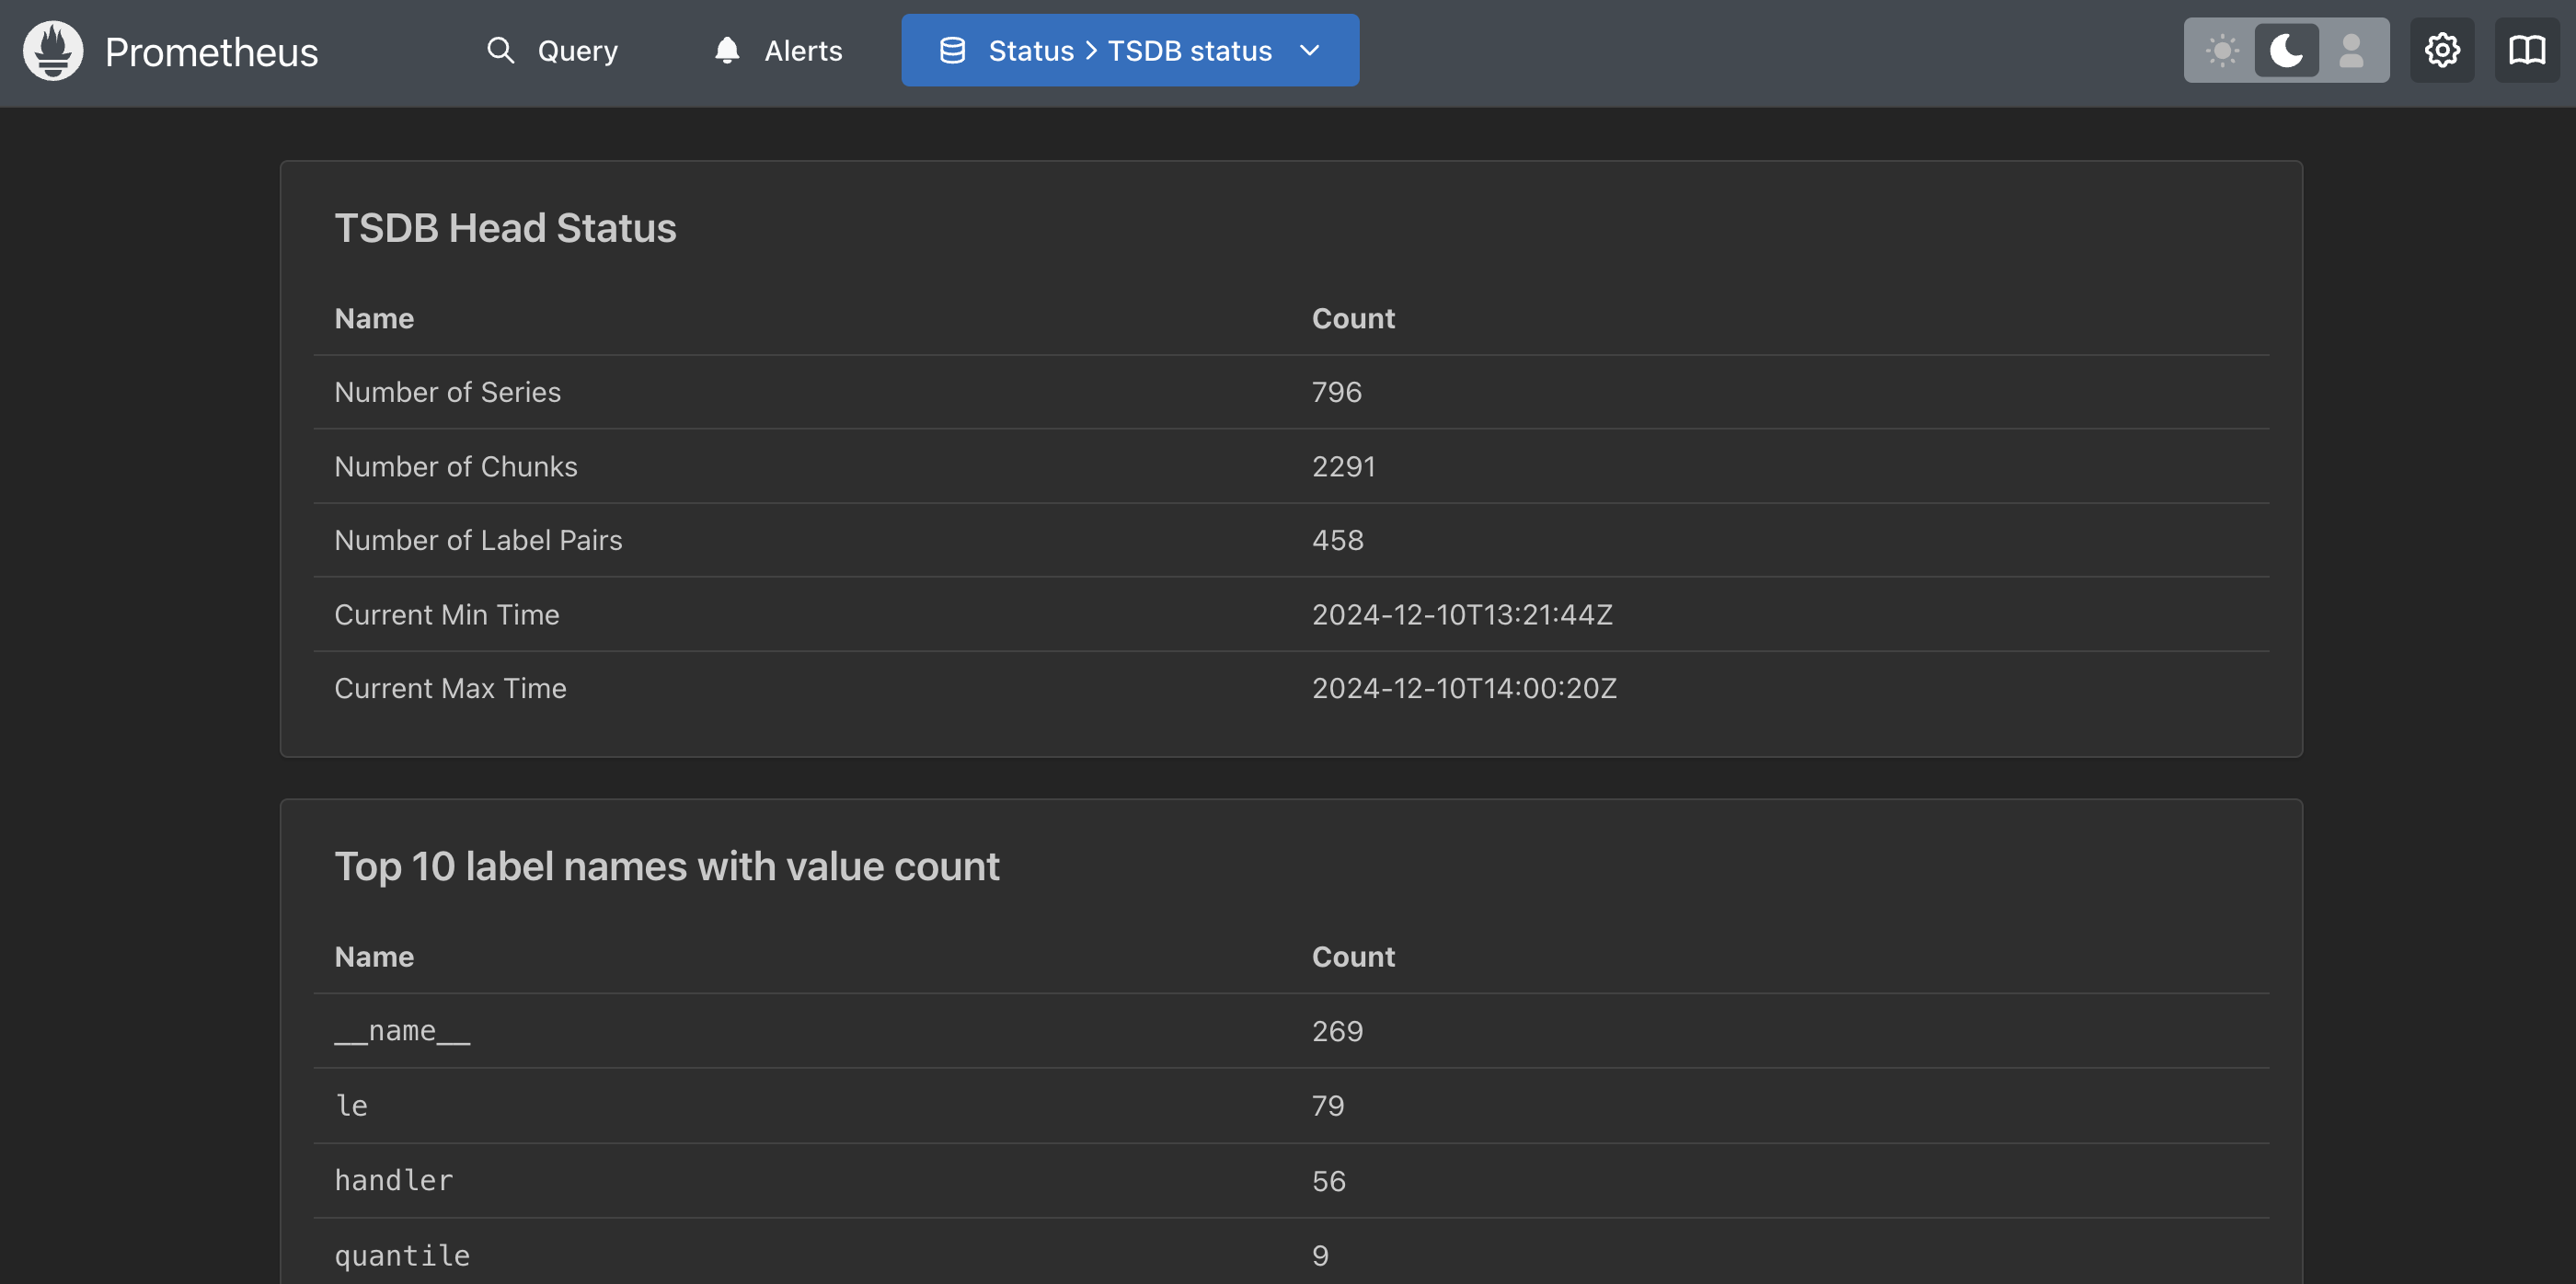
Prometheus - Time series database status
Next, there is a status page you can use to view your time series database, or TSDB, status.
Using the drop down menu again at the top labeled
STATUS and selecting
TSDB-STATUS:

Prometheus - Time series database status
This shows you some details for the time series being collected in an overview status line with
several tables below with cardinality status:

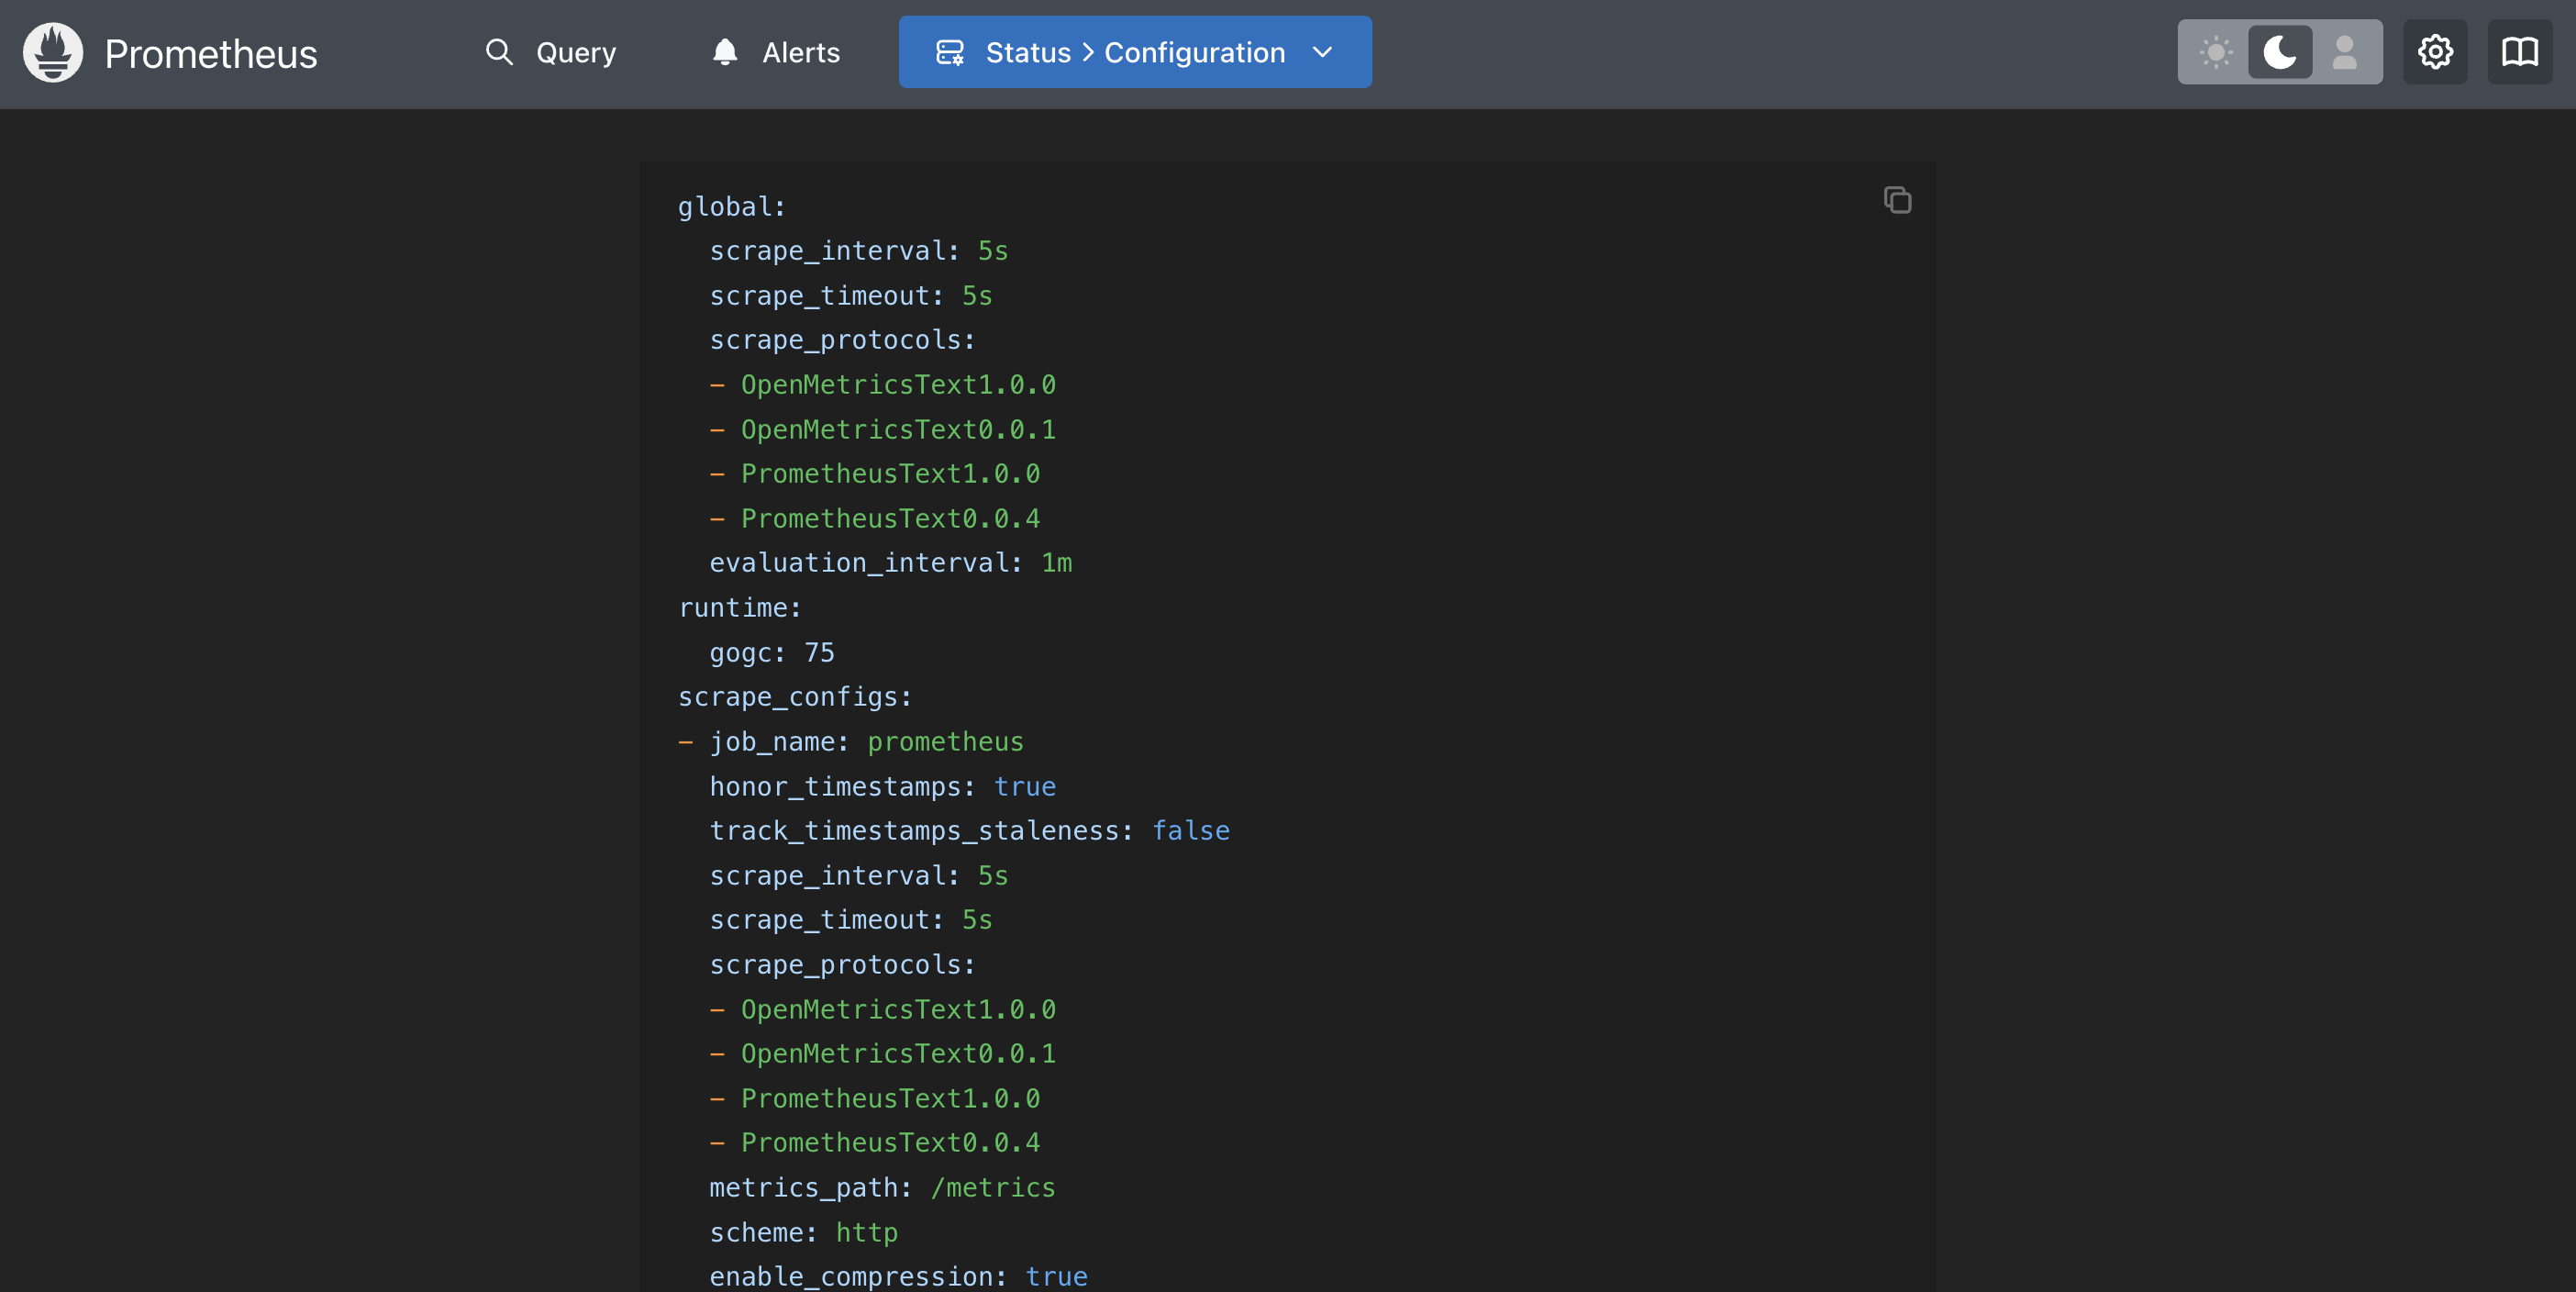
Prometheus - Exploring active configuration
Lastly, at least in this lab, you can verify the exact configuration being applied to your
Prometheus server. Using the drop down menu again at the top labeled
STATUS
and selecting CONFIGURATION:

Prometheus - Exploring active configuration
This shows you your exact configuration, often including some defaults that you might not have
in your personal configuration file, yet are begin used. There is even a handy copy-to-clipboard
button for you to grab it:

Prometheus - Using the expression tooling
You can navigate back to the expression browser that let's you query your time series data
by clicking on the menu entry
GRAPH. This is the default built-in query
interface for running Prometheus Query Language (PromQL) queries. Be sure you are in the
TABLE tab:

Prometheus - Total samples ingested
The
TABLE view provides the output of a query written using PromQL expression as
a series. It's less expensive to use than the other option, GRAPH, because you are
not plotting out the series answers in a graph. Without worrying about the PromQL used (we'll
explore that later in this workshop), lets show the total number of samples ingested by our
Prometheus server since it started:
							# Copy this line below comments into the Expression field and
# click on the EXECUTE button on the right side of the screen.
#
prometheus_tsdb_head_samples_appended_total
Prometheus - Validating an expression
You will have noticed that there are three buttons to the right of the
EXPRESSION entry field. The first one can be used to explore available
metrics, the second to validate the expression you entered, and the last one to show a tree
view of complexer queries (this one is not complex). We'll just click on the
FORMAT EXPRESSION menu entry and if it's a good expression you get a
validation pop-up as shown below:


Prometheus - Execute the expression query
After validating our expression, run it by clicking on the
EXECUTE button:

Prometheus - Exploring the visualization
Let's explore by clicking on the
GRAPH tab. Note the features included to
visualize queries. I have adjusted this instance to look at 1m of data here and browsing the
results:

Prometheus - Add another query
Go back to the
TABLE tab. Notice at the bottom there is a button
ADD QUERY, click on it to add another query panel in which we will execute
the following query expression. Let's look at the number of samples ingested per second averaged
over a 1m window of time:
							# Copy this line below comments into the Expression field and
# click on the EXECUTE button on the right side of the screen.
#
rate(prometheus_tsdb_head_samples_appended_total[1m])
Prometheus - Execute the second query
You can now see multiple expressions are possible:

Prometheus - Exploring second visualization

Intermezzo - Warning about pages
If you now select any of the status pages from the
Pro tip: you might want to work using browser tabs.
STATUS menu at the top
and then return to the expression query page using the GRAPH menu entry, you
will notice that extra panels you might have added will be gone.Pro tip: you might want to work using browser tabs.
Prometheus - One last query
Assuming you went to another status page and back, we have a last query we will run here to
simulate the same query used to fill the system UP metric we viewed for our Prometheus target:
							# Copy this line below comments into the Expression field and
# click on the EXECUTE button on the right side of the screen.
#
up{job="prometheus"}
Prometheus - Execute the second query
You can now see the results as a boolean value suggesting it is really UP:

Prometheus - Exploring this silly visualization
This is a rather silly metric to visualize this way, but this is what it looks like going back
over 30 mins as my server was running during this lab's development (you can check my working
hours if we look closely):

Lab completed - Results

Next up, exploring the query language...

Contact - are there any questions?
Eric D. Schabell
Director Evangelism
Contact: @ericschabell {@fosstodon.org) or https://www.schabell.org
Director Evangelism
Contact: @ericschabell {@fosstodon.org) or https://www.schabell.org
Up next in workshop...
Lab 2 - Installing Prometheus (binary package)