Lab 3 - Exploring dashboard tooling
Lab Goal
To explore the Perses API and be able to use the Perses command line tooling to gain insights into the current available projects, dashboards, and data sources.
Perses API - A little background
After installing Perses in the previous lab, you have the dashboard open in your browser. There
is an application programming interface (API) available for you to gain insights into the
configuration applied to your Perses server. You can find out more about the projects,
dashboards, and data sources that have been created. This can be handy to start with existing
resources and modify them for your own versions.
Perses API - The basic operations
The Perses API provides access to five operations (API end points) for every resource, listed
here in no particular order:
On the next slide you will explore some of the browser based API insights Perses provides.
- creating a resource
- updating a resource
- deleting a resource
- retrieving a single resource
- retrieving a list of resources
On the next slide you will explore some of the browser based API insights Perses provides.
Perses API - Viewing existing projects
You can view the configured projects on your Perses server with a browser, just enter this URL:
This shows you un-formatted JSON output of the available projects. You should see the single
http://localhost:8080/api/v1/projectsThis shows you un-formatted JSON output of the available projects. You should see the single
WorkshopProject listed:

Perses API - Viewing projects (YARC)
Browsers are not great for viewing API responses, so let's use
a REST Client (YARC) (install
extension on your own) that automatically formats all responses, but you can use your preferred
REST client. Enter
and click on SEND REQUEST button:
http://localhost:8080/api/v1/projectsand click on SEND REQUEST button:

Perses API - Project response (YARC)
You'll see the API response is formatted for easy consumption, much better than in the browser:

Perses API - Listing dashboards
Next we can look at the listing of available dashboards within the WorkshopProject with this
API request:
http://localhost:8080/api/v1/projects/workshopproject/dashboards

Perses API - Listing dashboards response
Note this view of the reply contains only partial results, as the response encompasses the
entire configuration for each available dashboard. In our case there is one dashboard listed as
MyFirstDashboard:

Perses API - Listing single dashboard
To grab an example configuration to start from a working dashboard, just specify a specific
dashboard:
http://localhost:8080/api/v1/projects/workshopproject/dashboards/MyFirstDashboard

Perses API - Single dashboard response
Now the output response is just a single dashboard configuration for
MyFirstDashboard:

Perses API - Listing data sources
Data sources are where we point our dashboard queries to. Often metrics gathering Prometheus
instances as we're using Prom Query Language (PromQL). Let's list them within
WorkshopProject:http://localhost:8080/api/v1/projects/workshopproject/datasources

Perses API - Data sources response
We see that there are three data source defined for our workshop demo project called in the
specification. You can browse them for details:

Perses API - Official documentation
We can't show all possible API usage here, so we will just consider these handled so far as
a basic introduction. It's enough to get you started and enough to know that the API is
available for you to explore further on your own. See the
API documentation
for more details.
Perses CLI - Command line tooling setup
If you choose the
If are using the container installation, then you will find a pre-built copy for your OS in
source installation, the percli
(command line) tooling is available in ./target/perses-[VERSION]/bin/percli.If are using the container installation, then you will find a pre-built copy for your OS in
./support/bin/percli-{OS_VERSION}-amd64.zip. Unzip the version for your
operating system (example below for OSX) and use to access the Perses container API (note, the
easy install project automatically unzips the version our OS needs):
							$ ls -1 ./support/bin/

percli-darwin-amd64.zip
percli-linux-amd64.zip
percli-windows-amd64.zip

$ unzip ./support/bin/percli-darwin-amd64.zip -d ./support/bin/

Archive:  ./support/bin/percli-darwin-amd64.zip
inflating: ./support/bin/percli
Perses CLI - Command line tooling usage
We're assuming you've just completed the setup for using the
percli command
line tooling. All examples shown in this lab will use the path to the tooling as shown below,
but you can use any path to the tooling you set up:
							$ ./support/bin/percli --help

Command line interface to interact with the Perses API

Usage:
  percli [command]

Available Commands:
  apply       Create or update resources through a file. JSON or YAML format supported
  completion  Generate the autocompletion script for the specified shell
  config      display local or remote config
  dac         Commands related to Dashboard-as-Code
  delete      Delete resources
  describe    Show details of a specific resource
  get         Retrieve any kind of resource from the API.
  help        Help about any command
  lint        Static check of the resources
  login       Log in to the Perses API
  migrate     migrate a Grafana dashboard to the Perses format
  plugin      Commands related to plugins development
  project     Select the project used by default.
  refresh     refresh the access token when it expires
  version     Display client version.
  whoami      Display current user used

Flags:
  -h, --help                  help for percli
	  --log.level string      Set log verbosity level. Values: panic, fatal, error, warning, info, debug, trace (default "info")
	  --percliconfig string   Path to the percliconfig file to use for CLI requests. (default "/Users/erics/.perses/config.json")

Use "percli [command] --help" for more information about a command.
Perses CLI - Available commands
A few of the interesting available commands we will explore are:
- login - log in to an instance of the Perses API
- get - request a response from the Perses API
- project - select a project to be used as default
- describe - request details for a specific resource
- delete - delete a specific resource
- apply - create or update existing resources using JSON or YAML file
Perses CLI - The LOGIN command
The LOGIN command is used for connecting to a specific instance of the Perses API, in our case
we want to connect to our localhost server. Below is an image of the LOGIN command help
documentation:
							$ ./support/bin/percli login -h

Log in to the Perses API

Usage:
  percli login [URL] [flags]

Examples:

# Log in to the given server
percli login https://perses.dev

# Log in to the given server via delegated authentication, non-interactively
percli login https://demo.perses.dev --provider [slug_id] --client-id [client_id] --client-secret [client-secret]


Flags:
	  --client-id string           Client ID used for robotic access when using external authentication provider.
	  --client-secret string       Client Secret used for robotic access when using external authentication provider.
  -h, --help                       help for login
	  --insecure-skip-tls-verify   If true, server's certificate will not be checked for validity == insecure HTTPS connections.
  -p, --password string            Password used for the authentication.
	  --provider string            External authentication provider identifier. (slug_id)
	  --token string               Bearer token for authentication to the API server
  -u, --username string            Username used for the authentication.

Global Flags:
	  --log.level string      Set log verbosity level. Values: panic, fatal, error, warning, info, debug, trace (default "info")
	  --percliconfig string   Path to the percliconfig file to use for CLI requests. (default "/Users/erics/.perses/config.json")
Perses CLI - Logging in to Perses instance
First you need to log in to an instance of Perses before you can start exploring the API.
Connect to your Perses instance as follows (the command returns nothing):
$ ./support/bin/percli login http://localhost:8080
Perses CLI - The GET command
Now that we are connected, let's explore the GET command:
							$ ./support/bin/percli get -h

Retrieve any kind of resource from the API.

Usage:
  percli get [RESOURCE_TYPE] [PREFIX] [flags]

Examples:

# List all dashboards in the current project selected.
percli get dashboards

# List all dashboards that begin with a given name in the current project selected.
percli get dashboards node

# List all dashboards in a specific project.
percli get dashboards -p my_project

#List all dashboards as a JSON object.
percli get dashboards -a -ojson

Flags:
  -a, --all              If present, list requested object(s) across all projects. The project in current context ignored.
  -h, --help             help for get
  -o, --output string    Kind of display: json or yaml. Default is yaml
  -p, --project string   If present, the project scope for this CLI request

Global Flags:
	  --log.level string      Set log verbosity. Possible values: panic, fatal, error, warning, info, debug, trace (default "info")
	  --percliconfig string   Path to the percliconfig file to use for CLI requests. (default "/Users/erics/.perses/config.json")
Perses CLI - Listing all projects (GET)
Let's get a list of our projects using the GET argument as shown below and see again that we
have a single
WorkshopProject configured on our server:
							$ ./support/bin/percli get projects

       NAME       | AGE
------------------+------
  workshopproject | 21h
Perses CLI - Listing dashboards (GET)
Let's get a list of all dashboards using the GET argument as shown below:
							$ ./support/bin/percli get --all dashboards

        NAME       |     PROJECT     | AGE
-------------------+-----------------+------
  myfirstdashboard | workshopproject | 21h
Perses CLI - Listing data sources (GET)
A final example using GET, by first asking for a listing of all data sources:
							$ ./support/bin/percli get --all datasources

         NAME          |     PROJECT     |   DATASOURCE TYPE    | AGE
-----------------------+-----------------+----------------------+------
   prometheusbrowser   | workshopproject | PrometheusDatasource | 21h
   prometheusdemo      | workshopproject | PrometheusDatasource | 21h
   prometheusdemolocal | workshopproject | PrometheusDatasource | 21h
Perses CLI - The DESCRIBE command
You can list the details of a specific resource, such as a dashboard or data source using
DESCRIBE. The output will be in YAML by default (structured). Check out the documentation:
							$ ./support/bin/percli describe -h

Show details of a specific resource

Usage:
  percli describe [RESOURCE_TYPE] [NAME] [flags]

Examples:

## Describe a particular dashboard.
percli describe dashboard nodeExporter

## Describe a particular dashboard as a JSON object.
percli describe dashboard nodeExporter -ojson


Flags:
  -h, --help             help for describe
  -o, --output string    Kind of display: json or yaml. Default is yaml
  -p, --project string   If present, the project scope for this CLI request

Global Flags:
	  --log.level string      Set log verbosity. Possible values: panic, fatal, error, warning, info, debug, trace (default "info")
	  --percliconfig string   Path to the percliconfig file to use for CLI requests. (default "/Users/erics/.perses/config.json")
Perses CLI - Describing a data source
As previously done, get the details of our data source resource name, for example, we can use
PrometheusDemoLocal in the next slide:
							$ ./support/bin/percli get --all datasources

         NAME          |     PROJECT     |   DATASOURCE TYPE    | AGE
-----------------------+-----------------+----------------------+------
   prometheusbrowser   | workshopproject | PrometheusDatasource | 21h
   prometheusdemo      | workshopproject | PrometheusDatasource | 21h
   prometheusdemolocal | workshopproject | PrometheusDatasource | 21h
Perses CLI - Describing a data source
Using the name of the data source, we'll now request its details and expect formatted YAML
as the response (if you want unstructured JSON, try the
-ojson flag):
							$ ./support/bin/percli describe datasource prometheusdemolocal

kind: Datasource
metadata:
  name: prometheusdemolocal
  createdAt: 2024-08-28T16:07:19.538000824Z
  updatedAt: 2024-08-28T16:07:19.538000824Z
  version: 0
  project: workshopproject
spec:
  display:
    name: localhost:9090
  default: false
  plugin:
    kind: PrometheusDatasource
    spec:
      directUrl: http://localhost:9090
Perses CLI - The DELETE command
The next command we are going to explore is DELETE, which you can use to remove any resource
from your server. Here is the documentation (scroll down to see all of it):
							$ ./support/bin/percli delete -h

JSON and YAML formats are accepted.

If both a filename and command line arguments are passed, the command line arguments are
used and the filename is ignored. Note that the delete command does NOT do resource
version checks, so if someone submits an update to a resource right when you submit a
delete, their update will be lost along with the rest of the resource.

Usage:
  percli delete (-f [FILENAME] | TYPE ([NAME1 NAME2] | --all)) [flags]

Examples:
# Delete any kind of resources from a file
percli delete -f data.json

# Delete any kind of resources from stdin
cat data.json | percli delete -f -

# Delete a specific dashboard
percli delete dashboards node_exporter cadvisor

# Delete all dashboards
percli delete dashboards --all

Flags:
  -a, --all                Delete all resources in the project of the specified resource types.
  -d, --directory string   Path to the directory containing the resources consumed by the command.
  -f, --file string        Path to the file that contains the resources consumed by the command.
  -h, --help               help for delete
  -p, --project string     If present, the project scope for this CLI request

Global Flags:
	  --log.level string      Set log verbosity. Possible values: panic, fatal, error, warning, info, debug, trace (default "info")
	  --percliconfig string   Path to the percliconfig file to use for CLI requests. (default "/Users/erics/.perses/config.json")
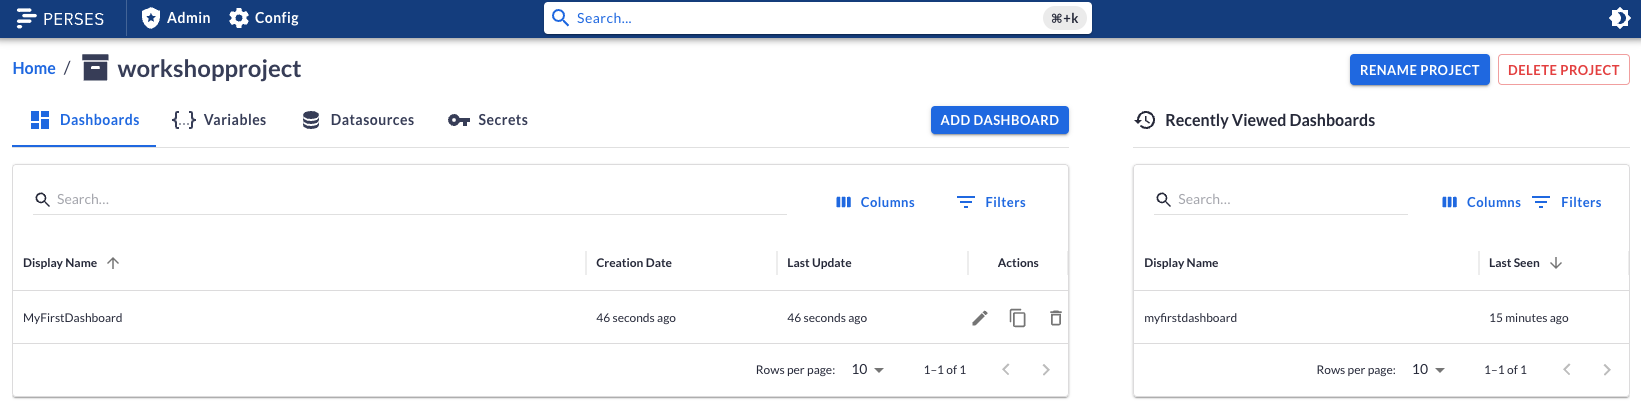
Perses CLI - Deleting a dashboard
Our server dashboard looks something like this currently:

Now let's remove
MyFirstDashboard dashboard on the next slide...
Perses CLI - Deleting my first dashboard
Remove the
MyFirstDashboard dashboard with the following:
							$ ./support/bin/percli delete dashboards MyFirstDashboard

object "Dashboard" "MyFirstDashboard" has been deleted in the project "workshopproject"
Perses CLI - Verifying deletion of dashboard
Reloading your Perses instance in the browser verifies that your dashboard has been removed, but
the project and datasources remain:

Perses CLI - The APPLY command
The APPLY command creates or updates any resource from a file. The changes are applied
to the server logged in to. Here is the documentation:
							$ ./support/bin/percli apply -h

Create or update resources through a file. JSON or YAML format supported

Usage:
  percli apply (-f [FILENAME] | -d [DIRECTORY_NAME]) [flags]

Examples:
# Create/update the resources from the file resources.json to the remote Perses server.
percli apply -f ./resources.json

# Create/update any resources from a folder
percli apply -d ./

# Apply the JSON passed into stdin to the remote Perses server.
cat ./resources.json | percli apply -f -

Flags:
  -d, --directory string   Path to the directory containing the resources consumed by the command.
  -f, --file string        Path to the file that contains the resources consumed by the command.
  -h, --help               help for apply
  -p, --project string     If present, the project scope for this CLI request

Global Flags:
	  --log.level string      Set log verbosity. Possible values: panic, fatal, error, warning, info, debug, trace (default "info")
	  --percliconfig string   Path to the percliconfig file to use for CLI requests. (default "/Users/erics/.perses/config.json")
Perses CLI - Applying dashboard update
Let's create a new
MyFirstDashboard using a provided file found in
./support/workshop-myfirstdashboard.json. It's a resource defining
our first dashboard, and we can update the server with this:
							$ ./support/bin/percli apply -f support/workshop-myfirstdashboard.json

object "Dashboard" "MyFirstDashboard" has been applied in the project "workshopproject"
Perses CLI - Verifying our dashboard update
All is back to normal if you reload your Perses instance in the browser:
Perses CLI - Basic understanding of API usage
You now have a basic understand of what the Perses API is, how to connect, how to query, and
an understanding of setting up the command line tooling. You've also explored some of the API
interactions using the command line tooling.
Lab completed - Results
Next up, exploring dashboard components...

Contact - are there any questions?
Eric D. Schabell
Director Evangelism
Contact: @ericschabell {@fosstodon.org) or https://www.schabell.org
Director Evangelism
Contact: @ericschabell {@fosstodon.org) or https://www.schabell.org
Up next in workshop...
Lab 3 - Exploring dashboard tooling